

Membrane dielectric changes indicate induced apoptosis in HL-60 cells more sensitively than surface phosphatidylserine expression or DNA fragmentation
- PMID: 12175924
- PMCID: PMC2726260
- DOI: 10.1016/s0005-2736(02)00495-9
Membrane dielectric changes indicate induced apoptosis in HL-60 cells more sensitively than surface phosphatidylserine expression or DNA fragmentation
Abstract
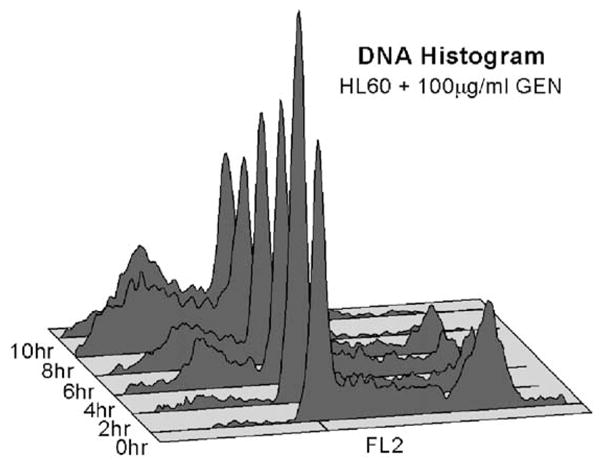
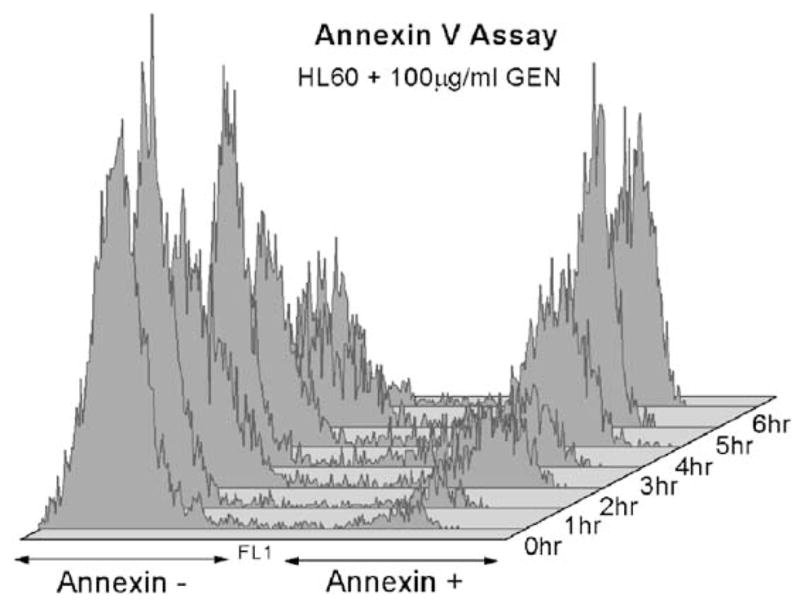
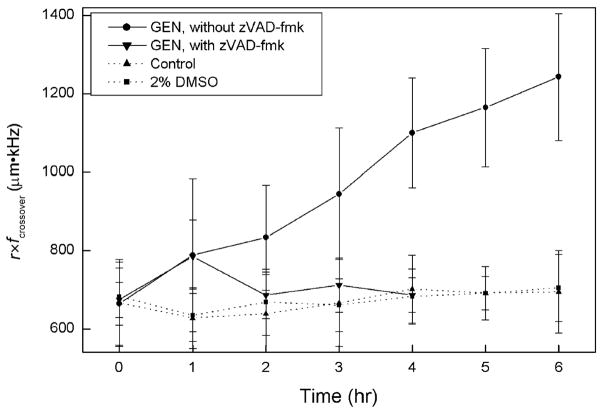
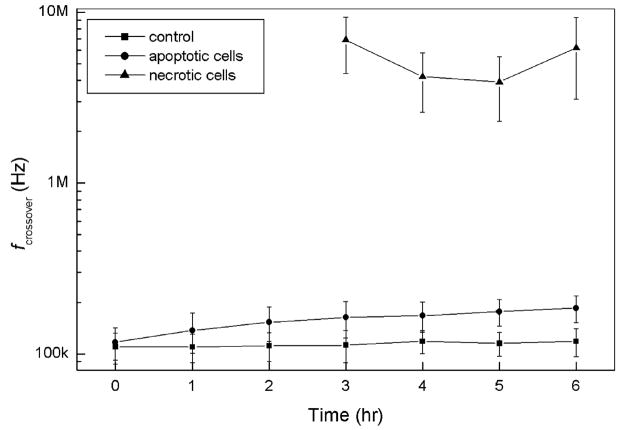
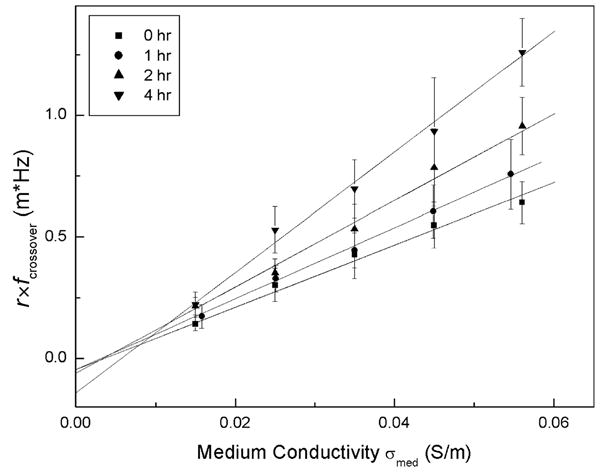
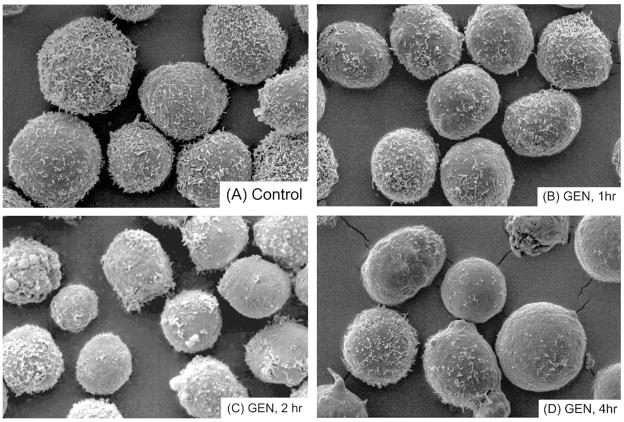
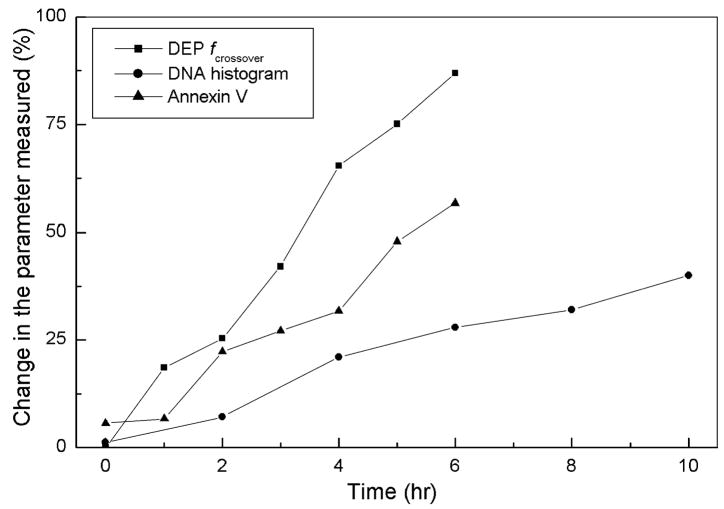
The specific membrane capacitance and conductivity of mammalian cells, which reflect their surface morphological complexities and membrane barrier functions, respectively, have been shown to respond to cell physiologic and pathologic changes. Here, the effects of induced apoptosis on these membrane properties of cultured human promyelocytic HL-60 cells are reported. Changes in membrane capacitance and conductivity were deduced from measurements of cellular dielectrophoretic crossover frequencies following treatment with genistein (GEN). The apparent specific cell membrane capacitance of HL-60 cells fell from an initial value of 17.6+/-0.9 to 9.1+/-0.5 mF/m(2) 4 h after treatment. Changes began within minutes of treatment and preceded both the externalization of phosphatidylserine (PS), as gauged by the Annexin V assay, and the appearance of a sub-G1 cell subpopulation, as determined through ethidium bromide staining of DNA. Treatment by the broad spectrum caspase inhibitor N-benzyloxycarbony-Val-Ala-Asp(O-methyl)-fluoromethyketone (zVAD-fmk) did not prevent these early cell membrane dielectric responses, suggesting that the caspase system was not involved. Although membrane conductivity did not alter during the first 4 h of GEN treatment, it rose significantly and progressively thereafter. Finally, as the barrier function failed and the cells became necrotic, it increased by many orders of magnitude. The effective membrane capacitance and conductivity findings serve to focus attention on the membrane as a site for early participation in apoptosis. In conjunction with our prior reports of the use of dielectric methods for cell manipulation and separation, these results demonstrate that dielectrophoretic technologies should be applicable to the rapid detection, separation, and quantification of normal, apoptotic, and necrotic cells from cell mixtures.
Figures
References
Publication types
MeSH terms
Substances
Grants and funding
LinkOut - more resources
Full Text Sources
Other Literature Sources
