Comparative Study
. 2002 Aug;12(8):1221-30.
doi: 10.1101/gr.200602.

Computational identification of operons in microbial genomes

Affiliations
Comparative Study

Computational identification of operons in microbial genomes

Yu Zheng et al. Genome Res. 2002 Aug.

Abstract

By applying graph representations to biochemical pathways, a new computational pipeline is proposed to find potential operons in microbial genomes. The algorithm relies on the fact that enzyme genes in operons tend to catalyze successive reactions in metabolic pathways. We applied this algorithm to 42 microbial genomes to identify putative operon structures. The predicted operons from Escherichia coli were compared with a selected metabolism-related operon dataset from the RegulonDB database, yielding a prediction sensitivity (89%) and specificity (87%) relative to this dataset. Several examples of detected operons are given and analyzed. Modular gene cluster transfer and operon fusion are observed. A further use of predicted operon data to assign function to putative genes was suggested and, as an example, a previous putative gene (MJ1604) from Methanococcus jannaschii is now annotated as a phosphofructokinase, which was regarded previously as a missing enzyme in this organism. GC content changes in the operon region and nonoperon region were examined. The results reveal a clear GC content transition at the boundaries of putative operons. We looked further into the conservation of operons across genomes. A trp operon alignment is analyzed in depth to show gene loss and rearrangement in different organisms during operon evolution.


Figures

Figure 1
Figure 1
(a) Phenylpropionate catabolic pathway, mhpABCDE catalyzes successive reactions. (b) (Subsets of genes in the mhp operon involved in different pathways left) and the actual reaction chains in the pathways catalyzed by these genes (right). This figure gives an example where computing transitive closure of smaller operons on the chromosome gives a larger operon. All genes run in the same direction.
Figure 1
Figure 1
(a) Phenylpropionate catabolic pathway, mhpABCDE catalyzes successive reactions. (b) (Subsets of genes in the mhp operon involved in different pathways left) and the actual reaction chains in the pathways catalyzed by these genes (right). This figure gives an example where computing transitive closure of smaller operons on the chromosome gives a larger operon. All genes run in the same direction.
Figure 2
Figure 2
Men operon in E. coli. Part of the ubiquinone biosynthetic pathway is shown on the left. The genomic region containing this operon is shown on the right. Inside the enzyme nodes (rectangle) of the pathway, the names of the matched genes are shown in brackets, e.g., b2264 encodes a bifunctional protein with two enzymatic activities (Palaniappan et al. 1992). The gene filled with gray (b2263) encodes a product that is currently annotated as a hypothetical protein.
Figure 3
Figure 3
Distribution of operon length in E. coli. The solid line shows the distribution of operon length in the E. coli genome. The broken line shows the distribution in the randomly shuffled E. coli genome. (inset) A normalized histogram of operon length distribution in E. coli.
Figure 4
Figure 4
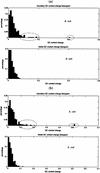
GC content change inside operons and at operon boundaries. Histogram of GC content change (x-axis, 0 ∼1) in operon and boundary regions in E. coli (a) and B. subtilis (b). GC content change was computed from two genes next to each other. If both of them are inside an operon, it is counted as inside operons. If either one is outside of the operon, it is counted as at the boundaries. GC content change is calculated for each gene. Ellipses mark the high GC transitions at the boundaries of the operons.
Figure 5
Figure 5
trp operon alignment. Genes are drawn with directions (sharp end is a transcription stop) and are labeled with all the enzymatic activities they have. Genes colored gray are nonenzymes and are not inside the operon. The single line represents a DNA strand (5′ to 3′). Double lines represent both strands.
Figure 6
Figure 6
A graphical interpretation of breadth-first search (BFS) graph traversal. The black vertex is the start vertex for BFS traversal in a metabolic pathway. In this example, the depth parameter is set to 2; the first layer is filled with dark gray and the second layer is filled with light gray. After a tree is returned from traversal, we locate the gene in the genome with the same EC number as the start vertex and extend a window on each side of it. We then compare genes in this window and in the traversal tree by EC numbers. If there is more than one match, this gene cluster window is marked for further pruning.
Figure 7
Figure 7
Graphical illustration of pruning procedure. Nodes with the labels A,B,C,D in the pathway graph and the genome (line) are matched enzymes. The black vertex is the remote gene, which is three reaction steps away from the nearest gene (A) in the graph and three open reading frames (ORFs) away from the nearest gene (A) on the chromosome (gray genes are genes that were not matched). Consequently, the black vertex gets pruned from the cluster. The idea of pruning is implemented by computing the shortest distance in the graph from each matched vertex to the nearest matched vertex. A special case occurs when only two genes are reported as a possible operon. If their metabolic distance is equal to 3, they are pruned out.
Figure 8
Figure 8
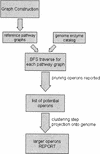
Flowchart of our computational pipeline.

References

    1. Altschul SF, Madden TL, Schaffer AA, Zhang J, Zhang Z, Miller W, Lipman DJ. Gapped BLAST and PSI-BLAST: A new generation of protein database search algorithms. Nucleic Acids Res. 1997;25:3389–3402. - PMC - PubMed
    1. Bono H, Ogata H, Goto S, Kanehisa M. Reconstruction of amino acid biosynthesis pathways from the complete genome sequence. Genome Res. 1998;8:203–210. - PubMed
    1. Bult CJ, White O, Olsen GJ, Zhou L, Fleischmann RD, Suttonh GG, Blake JA, Fitzgerald LM, Clauton RA, Gocayne JD, et al. Complete genome sequence of the Methanogenic archaeon, Methanococcus jannaschi. Science. 1996;273:1058–1073. - PubMed
    1. Burlingame RP, Wyman L, Chapman PJ. Isolation and characterization of Escherichia colimutants defective for phenylpropionate degradation. J Bacteriol. 1986;168:55–64. - PMC - PubMed
    1. Dandekar T, Schuster S, Snel B, Huynen M, Bork P. Pathway alignment: Application to the comparative analysis of glycolytic enzymes. Biochem J. 1999;343:115–124. - PMC - PubMed

Publication types