. 2002 Aug;12(8):1257-68.
doi: 10.1101/gr.129702.

Voluntary ethanol consumption by mice: genome-wide analysis of quantitative trait loci and their interactions in a C57BL/6ByJ x 129P3/J F2 intercross

Affiliations

Voluntary ethanol consumption by mice: genome-wide analysis of quantitative trait loci and their interactions in a C57BL/6ByJ x 129P3/J F2 intercross

Alexander A Bachmanov et al. Genome Res. 2002 Aug.

Abstract

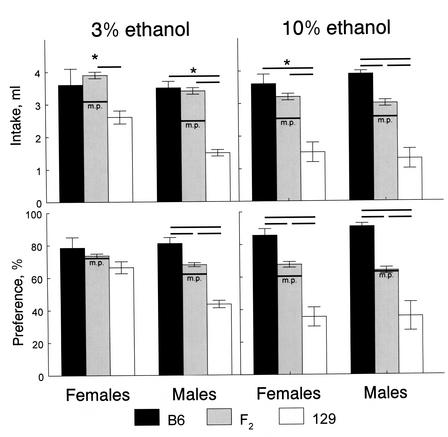
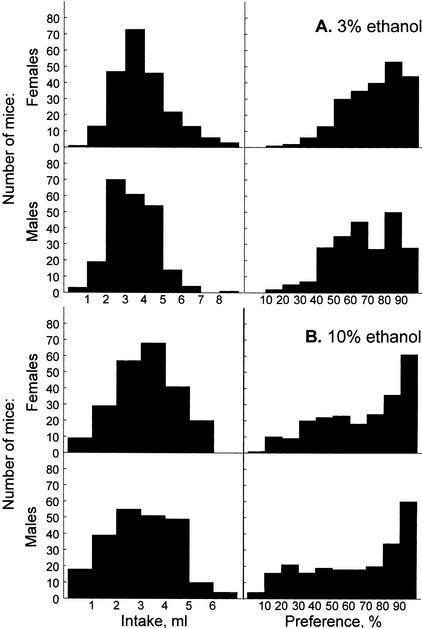
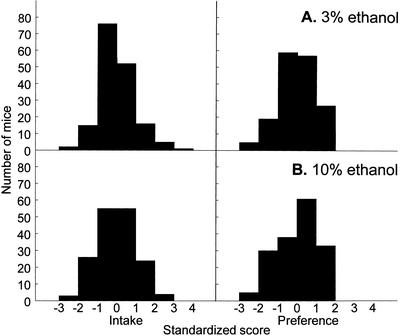
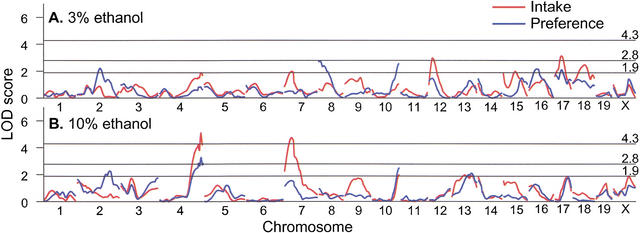
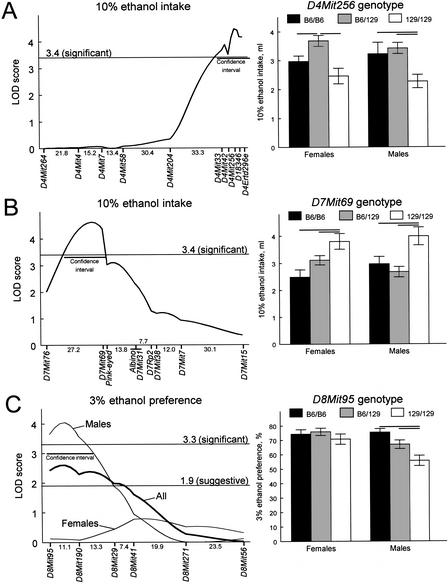
Consumption of ethanol solutions by rodents in two-bottle choice tests is a model to study human alcohol intake. Mice of the C57BL/6ByJ strain have higher ethanol preferences and intakes than do mice of the 129P3/J strain. F2 hybrids between these two strains were phenotyped using two-bottle tests involving a choice between water and either 3% or 10% ethanol. High ethanol preferences and intakes of the B6 mice were inherited as additive or dominant traits in the F2 generation. A genome screen using these F2 mice identified three significant linkages. Two loci, on distal chromosome 4 (Ap3q) and proximal chromosome 7 (Ap7q), strongly affected 10% ethanol intake and weakly affected 3% ethanol intake. A male-specific locus on proximal chromosome 8 (Ap8q) affected 3% ethanol preference, but not indexes of 10% ethanol consumption. In addition, six suggestive linkages (on chromosomes 2, 9, 12, 13, 17, and 18) affecting indexes of 3% and/or 10% ethanol consumption were detected. The loci with significant and suggestive linkages accounted for 35-44% of the genetic variation in ethanol consumption phenotypes. No additive-by-additive epistatic interactions were detected for the primary loci with significant and suggestive linkages. However, there were a few modifiers of the primary linkages and a number of interactions among unlinked loci. This demonstrates a significant role of the genetic background in the variation of ethanol consumption.


Figures

Figure 1
Figure 1
Average daily ethanol intakes and preferences of B6, 129, and F2 mice (means ± standard errors). Horizontal lines above the bars represent significant differences between groups (P<0.05, planned comparisons, ANOVA). Horizontal lines labeled “m.p.” on the F2 bars show midparental values (average of B6 and 129 means). *Significant difference between F2 and midparental values (P<0.05, planned comparisons between the F2 and a collapsed value of the two parental strains).
Figure 2
Figure 2
Distributions of 3% (A) and 10% (B) ethanol intakes (left) and preferences (right) in F2 mice. Top rows, females (n = 224); bottom rows, males (n = 226).
Figure 3
Figure 3
Distributions of standardized 3% (A) and 10% (B) ethanol intakes (left) and preferences (right) in a subset of F2 mice of both genders used for genotyping (n = 169).
Figure 4
Figure 4
Genome-wide scan for linkages with indexes of 3% (A) and 10% (B) ethanol consumption. Distances between markers were estimated using MAPMAKER/EXP. Curves trace the logarithm of the odds ratio (LOD) scores calculated under an unconstrained (free) model using MAPMAKER/QTL. Horizontal lines show thresholds for significant (LOD 4.3) and suggestive (LOD 2.8) linkages under the unconstrained model (Lander and Kruglyak 1995), and a more relaxed threshold (LOD 1.9) used to identify regions of potential linkages for additional genotyping.
Figure 5
Figure 5
Significant linkages. Left panels show results of interval mapping. Distances between markers in cM were estimated using MAPMAKER/EXP and are shown below the X-axis. Curves trace the logarithm of the odds ratio (LOD) scores calculated under locus-specific models using MAPMAKER/QTL. Horizontal lines show thresholds for suggestive and/or significant linkages under the locus-specific models (Lander and Kruglyak 1995). Confidence intervals (LOD drops of 1.0 from the peak) are shown by horizontal bars. Right panels show ethanol intakes or preferences by mice with different genotypes at a maker with the strongest linkage (means ± standard errors). Horizontal bars represent significant differences between groups (P<0.05, planned comparisons, two-way ANOVA). (A) A locus on distal chromosome 4 (Ap3q) affecting 10% ethanol intake. Left: B6-dominant model; the confidence interval spans region from 4 cM proximal to D4Mit33 to the telomeric end. Right: effects of D4Mit256 genotype, F(2,154) = 13.14, P = 0.000005, gender, F(1,154) = 0.11, P = 0.74, and their interaction, F(2,154) = 0.61, P = 0.55. (B) A locus on proximal chromosome 7 (Ap7q) affecting 10% ethanol intake. Left: B6-dominant model; the confidence interval spans region from 8 cM distally to D7Mit76 to 1 cM distally to D7Mit69. Right: effects of D7Mit69 genotype, F(2,160) = 11.08, P = 0.000031, gender, F(1,160) = 0.14, P = 0.71, and their interaction, F(2,160) = 2.19, P = 0.12. (C) A male-specific locus on proximal chromosome 8 (Ap8q) affecting 3% ethanol preference. Left: additive model; the confidence interval spans region from the centromeric end to 6 cM distally to D8Mit190. Right: effects of D8Mit95 genotype, F(2,161) = 6.40, P = 0.0021, gender, F(1,161) = 8.69, P = 0.0037, and their interaction, F(2,161) = 2.90, P = 0.058.

References

    1. Arola L, Roig R, Cascon E, Brunet MJ, Fornos N, Sabate M, Raga X, Batista J, Salvado MJ, Blade C. Model for voluntary wine and alcohol consumption in rats. Physiol Behav. 1997;62:353–357. - PubMed
    1. Bachmanov AA, Reed DR, Tordoff MG, Price RA, Beauchamp GK. Intake of ethanol, sodium chloride, sucrose, citric acid, and quinine hydrochloride solutions by mice: A genetic analysis. Behav Genet. 1996a;26:563–573. - PMC - PubMed
    1. Bachmanov AA, Tordoff MG, Beauchamp GK. Ethanol consumption and taste preferences in C57BL/6ByJ and 129/J mice. Alcohol Clin Exp Res. 1996b;20:201–206. - PMC - PubMed
    1. Bachmanov AA, Reed DR, Ninomiya Y, Inoue M, Tordoff MG, Price RA, Beauchamp GK. Sucrose consumption in mice: Major influence of two genetic loci affecting peripheral sensory responses. Mamm Genome. 1997;8:545–548. - PMC - PubMed
    1. Bachmanov AA, Beauchamp GK, Tordoff MG. Voluntary consumption of ethanol in 28 inbred mouse strains (Abstract) Alcohol Clin Exp Res. 2000;24:58A. - PubMed

Publication types

Substances