. 2002 Aug 19;158(4):741-50.
doi: 10.1083/jcb.200205025. Epub 2002 Aug 12.

FGF signaling targets the pRb-related p107 and p130 proteins to induce chondrocyte growth arrest

Affiliations

FGF signaling targets the pRb-related p107 and p130 proteins to induce chondrocyte growth arrest

Emmanuel Laplantine et al. J Cell Biol. .

Abstract

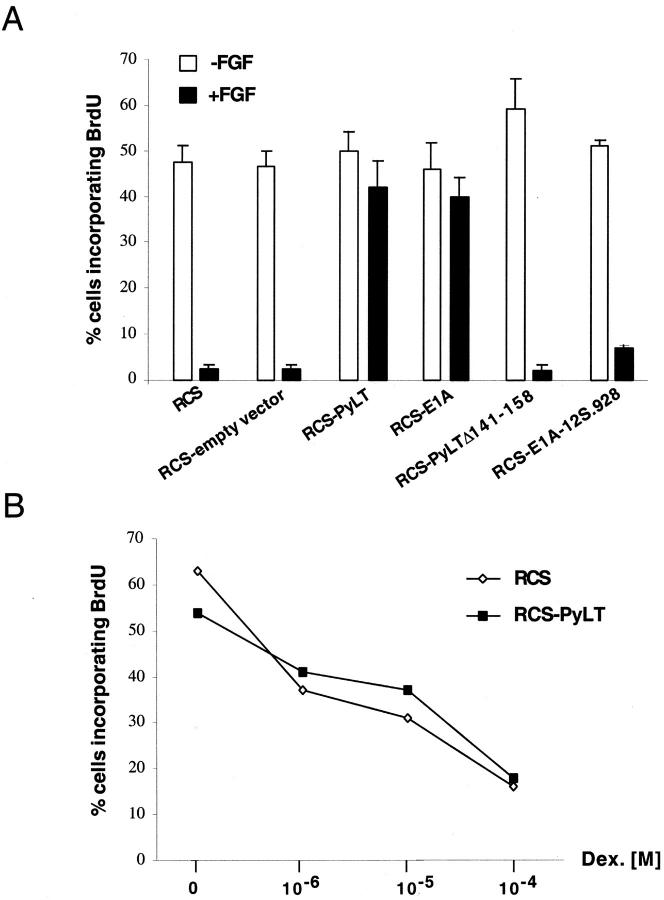
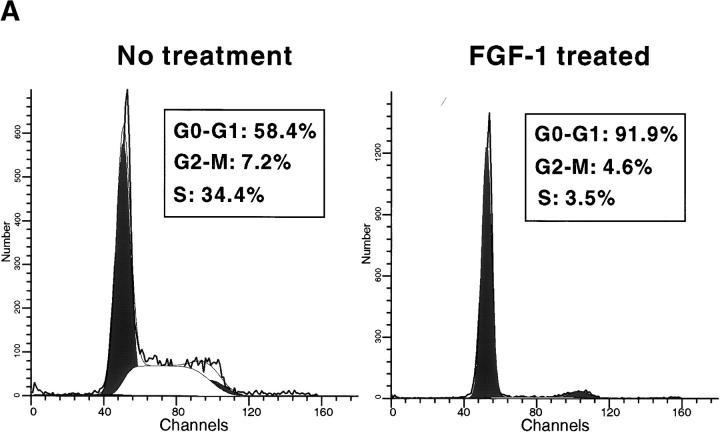
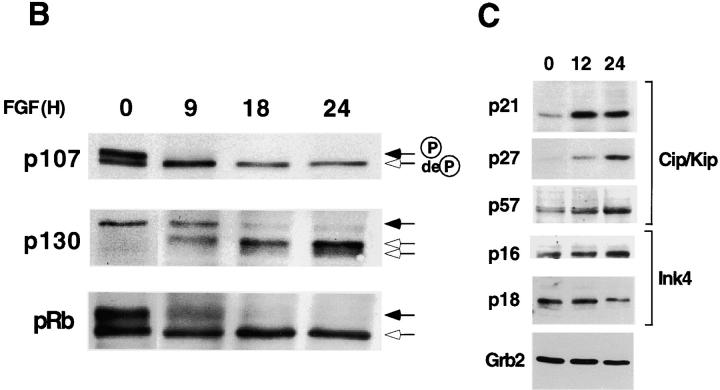
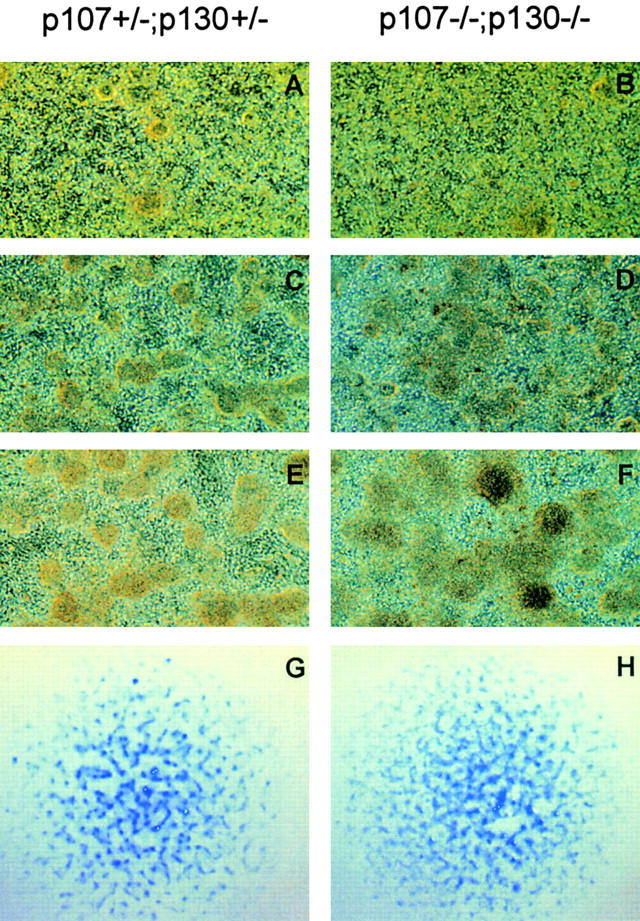
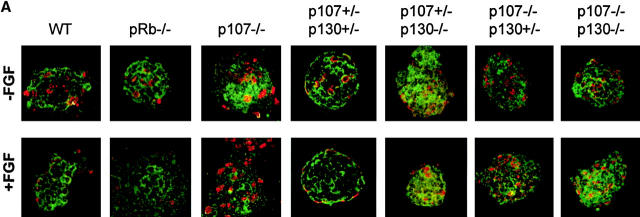
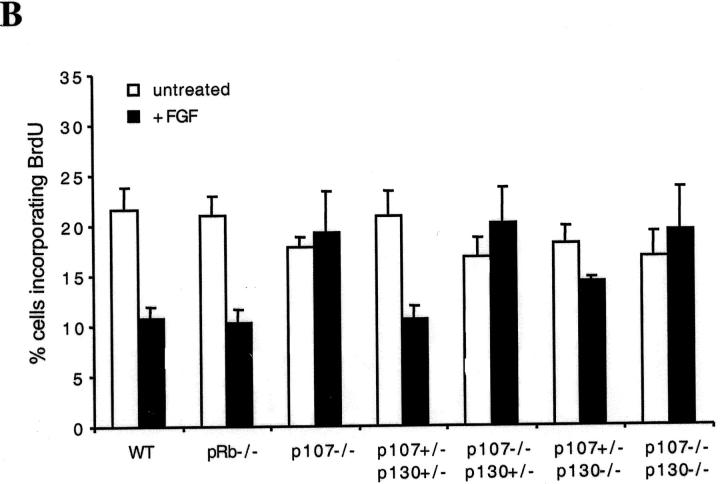
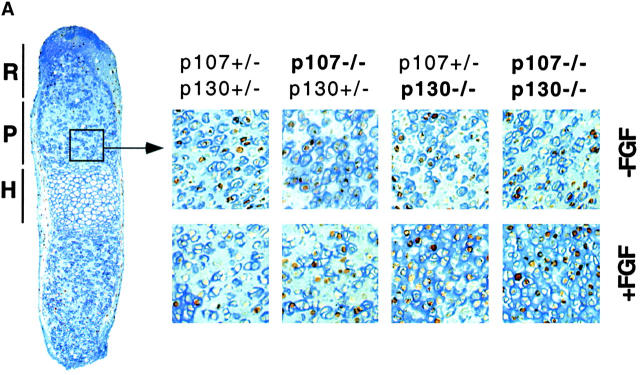
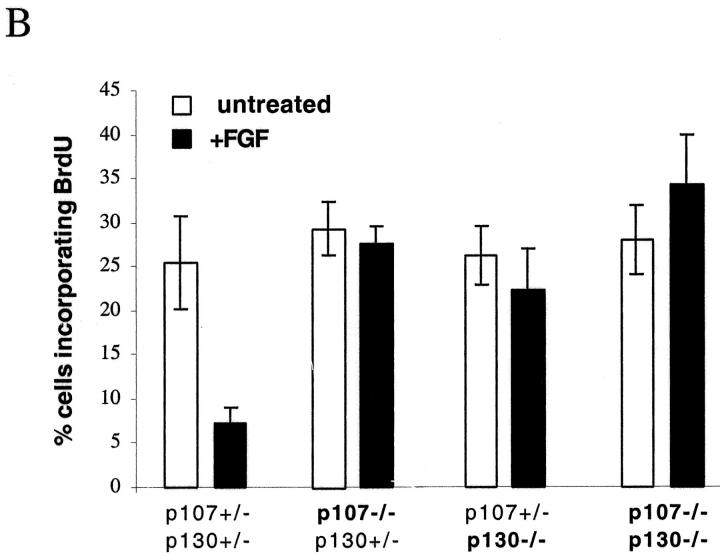
Unregulated FGF signaling affects endochondral ossification and long bone growth, causing several genetic forms of human dwarfism. One major mechanism by which FGFs regulate endochondral bone growth is through their inhibitory effect on chondrocyte proliferation. Because mice with targeted mutations of the retinoblastoma (Rb)-related proteins p107 and p130 present severe endochondral bone defects with excessive chondrocyte proliferation, we have investigated the role of the Rb family of cell cycle regulators in the FGF response. Using a chondrocyte cell line, we found that FGF induced a rapid dephosphorylation of all three proteins of the Rb family (pRb, p107, and p130) and a blockade of the cells in the G1 phase of the cell cycle. This cell cycle block was reversed by inactivation of Rb proteins with viral oncoproteins such as polyoma large T (PyLT) antigen and Adenovirus E1A. Expression of a PyLT mutant that efficiently binds pRb, but not p107 and p130, allowed the cells to be growth inhibited by FGF, suggesting that pRb itself is not involved in the FGF response. To investigate more precisely the role of the individual Rb family proteins in FGF-mediated growth inhibition, we used chondrocyte micromass culture of limb bud cells isolated from mice lacking Rb proteins individually or in combination. Although wild-type as well as Rb-/- chondrocytes were similarly growth inhibited by FGF, chondrocytes null for p107 and p130 did not respond to FGF. Furthermore, FGF treatment of metatarsal bone rudiments obtained from p107-/-;p130-/- embryos failed to inhibit proliferation of growth plate chondrocytes, whereas rudiments from p107-null or p130-null embryos showed only a slight inhibition of growth. Our findings indicate that p107 and p130, but not pRb, are critical effectors of FGF-mediated growth inhibition in chondrocytes.


Figures

Figure 2.
Figure 2.
Functional inactivation of Rb proteins interferes with FGF-induced growth arrest. (A) BrdU incorporation assay of FGF-treated (10 ng/ml) or untreated RCS cells expressing either PyLT, E1A, or mutant of these proteins defective in Rb family proteins interaction (PYLTΔ141–158, E1A-12S.928). (B) BrdU incorporation assay of dexamethasone-treated parental and PyLT-expressing RCS cells. Note that proliferation assays presented in Figs. 2 and 3 were conducted at least three times and gave similar results. Quantification was evaluated by counting the number of BrdU-positive cells among the total number of cells (200–400 cells) from several representative fields (±SD).
Figure 1.
Figure 1.
FGF induces G1 arrest of RCS cells and dephosphorylation of Rb proteins. (A) FACScan™ analysis of propidium iodide–labeled cells, treated with 10 ng/ml FGF-1 (or left untreated) for 24 h. Percentage of cells in each phase of the cell cycle is indicated. (B) Time course analysis (Western blot) of the phosphorylation status of Rb protein family members (pRb, p107, and p130) after FGF treatment (10 ng/ml) of RCS cells. Black or white arrows indicate the position of the hyper- or hypophosphorylated forms of Rb proteins, respectively. (C) Western blot analysis showing the expression levels of Cdk inhibitors of the Cip/Kip (p21, p27, and p57) and Ink4 (p16 and p18) families, after 0, 12, and 24 h of FGF treatment. Equal amount of protein loading was confirmed by Grb2 immunodetection.
Figure 1.
Figure 1.
FGF induces G1 arrest of RCS cells and dephosphorylation of Rb proteins. (A) FACScan™ analysis of propidium iodide–labeled cells, treated with 10 ng/ml FGF-1 (or left untreated) for 24 h. Percentage of cells in each phase of the cell cycle is indicated. (B) Time course analysis (Western blot) of the phosphorylation status of Rb protein family members (pRb, p107, and p130) after FGF treatment (10 ng/ml) of RCS cells. Black or white arrows indicate the position of the hyper- or hypophosphorylated forms of Rb proteins, respectively. (C) Western blot analysis showing the expression levels of Cdk inhibitors of the Cip/Kip (p21, p27, and p57) and Ink4 (p16 and p18) families, after 0, 12, and 24 h of FGF treatment. Equal amount of protein loading was confirmed by Grb2 immunodetection.
Figure 3.
Figure 3.
RCS cells expressing a mutant PyLT protein that does not bind efficiently to p107 and p130 are growth inhibited by FGF. (A) Analysis of the interactions between Rb protein family members and PyLT versus PyLTΔ256–272 deletion mutant in RCS cells by coimmunoprecipitation. Rb protein family members were individually immunoprecipitated from lysates of RCS cells (lane 1), PyLT- expressing cells (lane 2), and PyLTΔ256–272–expressing cells (lane 3). After SDS-PAGE and Western blotting, membranes were probed with an anti-PyLT mAb (top panels). The same nitrocellulose membranes were stripped and reprobed with specific antibodies against pRb proteins (bottom panels). Black arrows indicate the position of wild-type PyLT (slower migrating) and mutant PyLT_256–272 (faster migrating). The asterisk indicates a nonspecific contaminant immunoprecipitated by the anti-pRb antibody and recognized by PyLT antibody. (B) BrdU incorporation assay of control RCS cells and RCS expressing either wild-type or mutant (PyLT_256–272) PyLT treated for 24 h with increasing concentration of FGF. (inset) Western blot analysis of the expression level of wild-type and mutant PyLT proteins in the cells used for these experiments.
Figure 4.
Figure 4.
Production of p107 +/− ;p130 +/− and p107 −/− ;p130 −/− chondrocytes in high density micromass cultures. (A–F) Phase-contrast image of micromass cultures from p107 +/− ;p130 +/− (A, C, and E) and p107 −/− ;p130 −/− (B, D, and F) cultures at day 1 (A and B), day 3 (C and D), and day 4 (E and F) after plating. (G and H) Alcian blue staining of chondrocyte foci in p107 +/− ;p130 +/− (G) and p107 −/− ;p130 −/− (H) cultures 3 d after plating, and shown at lower magnification than in A–F. Each blue spot represents a chondrocyte focus.
Figure 5.
Figure 5.
Loss of p107 and p130 impairs FGF-induced growth arrest in micromass chondrocytes. (A) Day 3 micromass cultures of the indicated genotypes were treated with FGF or vehicle for 24 h, and allowed to incorporate BrdU over the final 2 h. Chondrocytes were stained with anti–collagen II and an FITC-conjugated secondary antibody (green), and with anti-BrdU and a Cy3-conjugated secondary antibody (red), and analyzed by confocal microscopy. (B) Quantification of the percentage of BrdU(+) chondrocytes in a series of confocal sections from at least five foci for each genotype and each condition. Error bars represent SD of the percentages of BrdU(+) cells in each focus. Note that in FGF-treated wild-type (WT), Rb −/− and p107 +/− ;p130 +/− cultures, the majority of the BrdU(+) nuclei were at the periphery of the foci, and that growth inhibition was more substantial for cells within the cores of the foci.
Figure 5.
Figure 5.
Loss of p107 and p130 impairs FGF-induced growth arrest in micromass chondrocytes. (A) Day 3 micromass cultures of the indicated genotypes were treated with FGF or vehicle for 24 h, and allowed to incorporate BrdU over the final 2 h. Chondrocytes were stained with anti–collagen II and an FITC-conjugated secondary antibody (green), and with anti-BrdU and a Cy3-conjugated secondary antibody (red), and analyzed by confocal microscopy. (B) Quantification of the percentage of BrdU(+) chondrocytes in a series of confocal sections from at least five foci for each genotype and each condition. Error bars represent SD of the percentages of BrdU(+) cells in each focus. Note that in FGF-treated wild-type (WT), Rb −/− and p107 +/− ;p130 +/− cultures, the majority of the BrdU(+) nuclei were at the periphery of the foci, and that growth inhibition was more substantial for cells within the cores of the foci.
Figure 6.
Figure 6.
Absence of FGF-induced growth inhibition in bone rudiment chondrocytes lacking p107 and/or p130. Metatarsal bone rudiments from E15 embryos were isolated and cultivated in vitro for 48 h with or without FGF treatment (100 ng/ml for 24 h). BrdU was added during the last 6 h of the culture. After fixation, rudiments were processed for immunodetection of BrdU. Counterstaining with Alcian blue was done in order to stain the cartilage-specific sulfate proteoglycans present in the extracellular matrix. (A) Representative pictures of BrdU incorporation in the proliferative zone of the growth plate for the different genotypes analyzed. R, reserve zone; P, proliferating zone; H, hypertrophic zone. (B) Quantification. Note that error bars in Fig. 6 B represent the SD calculated from at least six counts (percentage of cells positive for BrdU) of 80–160 cells each. Organ culture experiments were performed twice and gave similar results.
Figure 6.
Figure 6.
Absence of FGF-induced growth inhibition in bone rudiment chondrocytes lacking p107 and/or p130. Metatarsal bone rudiments from E15 embryos were isolated and cultivated in vitro for 48 h with or without FGF treatment (100 ng/ml for 24 h). BrdU was added during the last 6 h of the culture. After fixation, rudiments were processed for immunodetection of BrdU. Counterstaining with Alcian blue was done in order to stain the cartilage-specific sulfate proteoglycans present in the extracellular matrix. (A) Representative pictures of BrdU incorporation in the proliferative zone of the growth plate for the different genotypes analyzed. R, reserve zone; P, proliferating zone; H, hypertrophic zone. (B) Quantification. Note that error bars in Fig. 6 B represent the SD calculated from at least six counts (percentage of cells positive for BrdU) of 80–160 cells each. Organ culture experiments were performed twice and gave similar results.

Similar articles

Cited by

References

    1. Ahrens, P.B., M. Solursh, R.S. Reiter, and C.T. Singley. 1979. Position-related capacity for differentiation of limb mesenchyme in cell culture. Dev. Biol. 69:436–450. - PubMed
    1. Aikawa, T., G.V. Segre, and K. Lee. 2001. Fibroblast growth factor inhibits chondrocytic growth through induction of p21 and subsequent inactivation of cyclin E-Cdk2. J. Biol. Chem. 276:29347–29352. - PubMed
    1. Basilico, C., and D. Moscatelli. 1992. The FGF family of growth factors and oncogenes. Adv. Cancer Res. 59:115–165. - PubMed
    1. Clarke, A.R., E.R. Maandag, M. van Roon, N.M. van der Lugt, M. van der Valk, M.L. Hooper, A. Berns, and H. te Riele. 1992. Requirement for a functional Rb-1 gene in murine development. Nature. 359:328–330. - PubMed
    1. Classon, M., and N. Dyson. 2001. p107 and p130: versatile proteins with interesting pockets. Exp. Cell Res. 264:135–147. - PubMed

Publication types

MeSH terms