

doi: 10.1093/nar/gnf085.
Use of hybridization kinetics for differentiating specific from non-specific binding to oligonucleotide microarrays
Affiliations
- PMID: 12177314
- PMCID: PMC134259
- DOI: 10.1093/nar/gnf085
Item in Clipboard
Use of hybridization kinetics for differentiating specific from non-specific binding to oligonucleotide microarrays
Nucleic Acids Res.
.
Abstract
Hybridization kinetics were found to be significantly different for specific and non-specific binding of labeled cRNA to surface-bound oligonucleotides on microarrays. We show direct evidence that in a complex sample specific binding takes longer to reach hybridization equilibrium than the non- specific binding. We find that this property can be used to estimate and to correct for the hybridization contributed by non-specific binding. Useful applications are illustrated including the selection of superior oligonucleotides, and the reduction of false positives in exon identification.
Figures
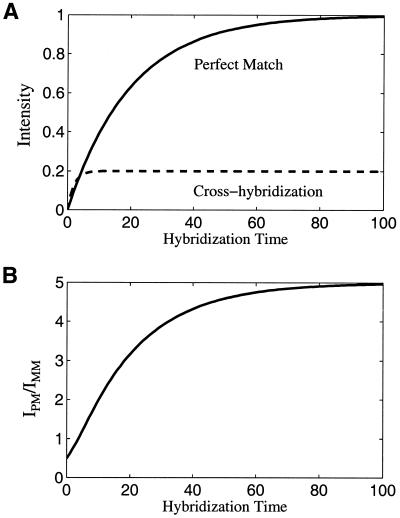
Simple illustrative theoretical model for perfect match hybridization and cross-hybridization kinetics. (A) Intensity of perfect match and cross-hybridization versus hybridization time. (B) The ratio of perfect match intensity to the cross-hybridization intensity as a function of time. These plots are intended for describing the qualitative trend, not for the quantitative predictions.
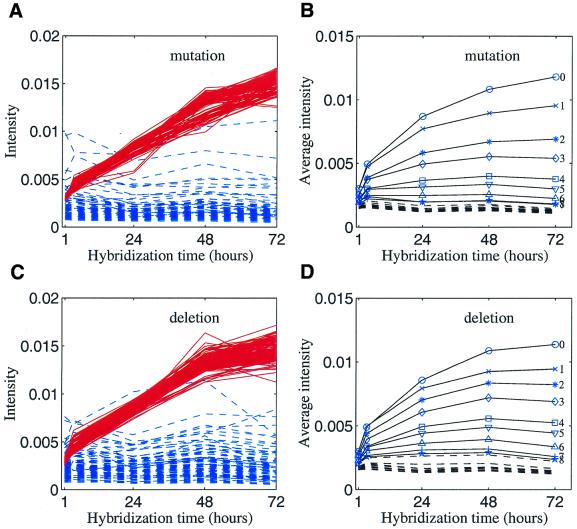
(A) Intensity versus hybridization time for each individual microarray spot. Red, oligos with perfect match. Blue, oligos with 10 base mutations. (B) Average intensity versus hybridization time. The intensity for a given number of mutations was averaged over 110 oligos (or 60 oligos for one base mutation) and averaged again over two synthetic mRNAs. The number at the end of each curve represents the number of mutations. Numbers greater than eight are not indicated in the plot since they overlap at the bottom of the figure. (C) Same as (A), except for deletions. (D) Same as (B), except for deletions.
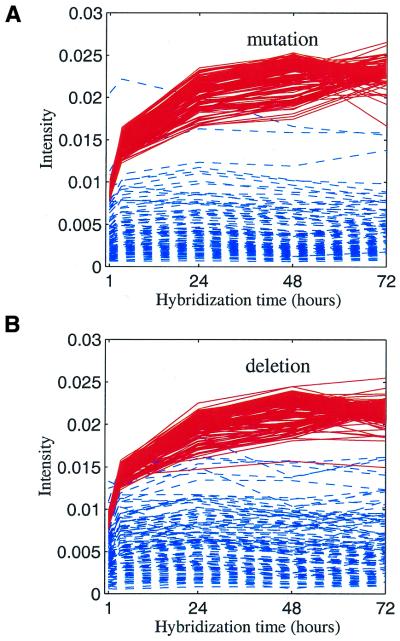
The fragmented sample. (A) Intensity versus hybridization time for each individual microarray spot. Red, oligos with perfect match. Blue, oligos with 10 base mutations. (B) Same as (A), except for deletions.
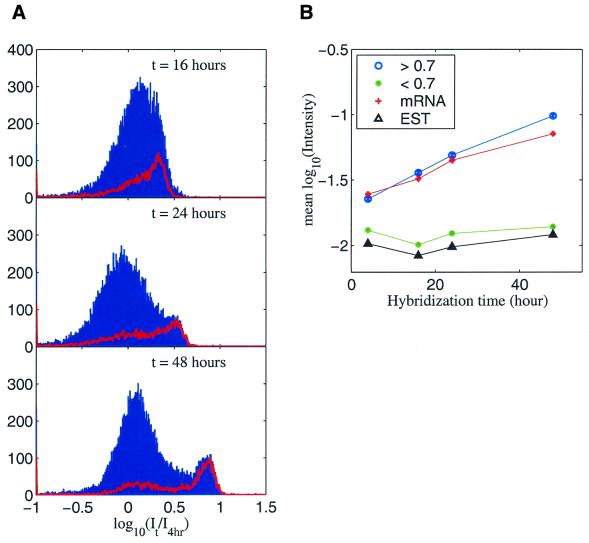
(A) Histogram of intensity ratios. Top, 16–4 h; middle, 24–4 h; bottom, 48–4 h. Red lines are the histograms for mRNA oligos only. (B) Mean log10(intensity) as a function of hybridization time. The ‘<0.7’ and ‘>0.7’ groups are divided according to log10(intensity for 48 h/intensity for 4 h).
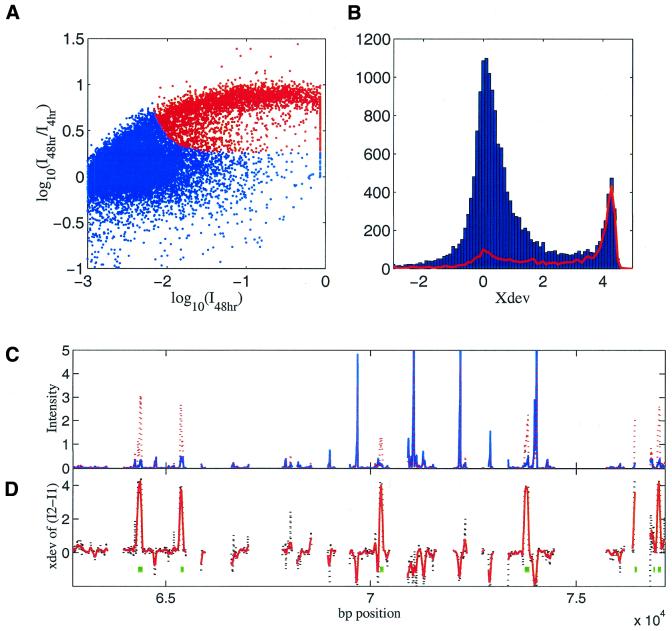
(A) Log intensity ratio (48 h hybridization/4 h hybridization) versus log intensity of 48 h hybridization for the jurkat sample. Spots in red are the ones with xdev > 2. The data were normalized to the scanner maximum dynamic range. Spots near the log intensity of 0 saturated the scanner. (B) Histogram of xdev (for time points at 4 and 48 h). Red line is the histogram for mRNA oligos only. (C) Hybridization intensity for Rb gene in the genomic region from 63 to 77 kb. Blue, intensity from 4 h hybridization. Red, intensity from 72 h hybridization. (D) xdev of 72 h intensity minus 4 h intensity. Black, xdev of each individual oligo. Red, running average of xdev of seven neighboring oligos. Green blocks are the known expressed exons.
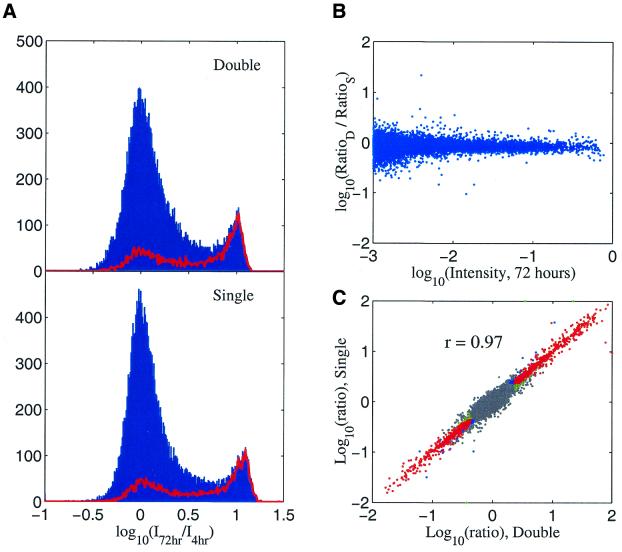
Comparison of hybridization results of repeat hybridizations versus single hybridization per microarray. Double, a single microarray hybridized and scanned at 4 h and put back for another 68 h hybridization and scanned again. Single, each array only hybridized and scanned once, two arrays involved for two time points. (A) Histograms of log10(intensity for 72 h/intensity for 4 h). Red lines, histograms for mRNA oligos. (B) The ratio of ratios defined in (A) versus oligo intensity at 72 h. RatioD, intensity ratio for the case of double; RatioS, intensity ratio for the case of single. (C) The two-color ratio (Jurkat/K562) for the double hybridizations versus the single hybridization (72 h).
References
-
- Schena M., Shalon,D., Davis,R.W. and Brown,P.O. (1995) Quantitative monitoring of gene expression patterns with a complementary DNA microarray. Science, 270, 467–470. - PubMed
-
- Lockhart D.J., Dong,H., Byrne,M.C., Follettie,M.T., Gallo,M.V., Chee,M.S., Mittmann,M., Wang,C., Kobayashi,M., Horton,H. and Brown,E.L. (1996) Expression monitoring by hybridization to high-density oligo arrays. Nat. Biotechnol., 14, 1675–1680. - PubMed
-
- Lipshutz R.J., Fodor,S.P., Gingeras,T.R. and Lockhart,D.J. (1999) High density synthetic oligo arrays. Nature Genet., 21, 20–24. - PubMed
-
- Khan J., Wei,J.S., Ringner,M., Saal,L.H., Ladanyi,M., Westermann,F., Berthold,F., Schwab,M., Antonescu,C.R., Peterson,C. and Meltzer,P.S. (2001) Classification and diagnostic prediction of cancers using gene expression profiling and artificial neural networks. Nature Med., 7, 777–888. - PMC - PubMed
MeSH terms
Substances
LinkOut - more resources
Full Text Sources
Other Literature Sources
