

The expression of HAK-type K(+) transporters is regulated in response to salinity stress in common ice plant
- PMID: 12177462
- PMCID: PMC166737
- DOI: 10.1104/pp.001149
The expression of HAK-type K(+) transporters is regulated in response to salinity stress in common ice plant
Abstract
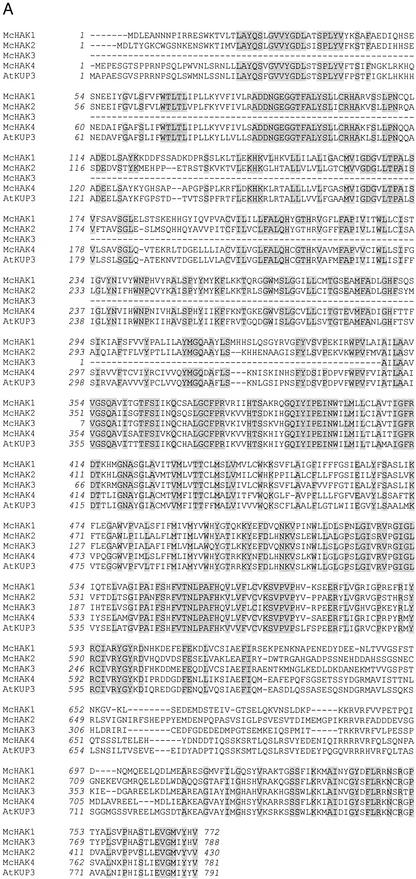
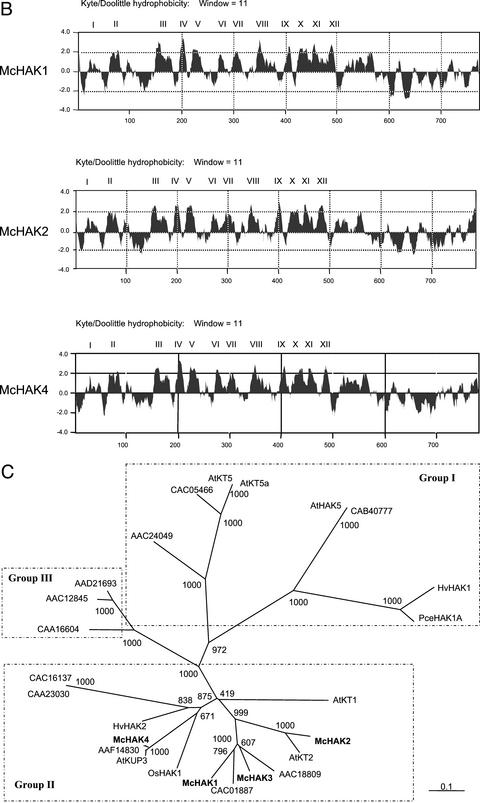
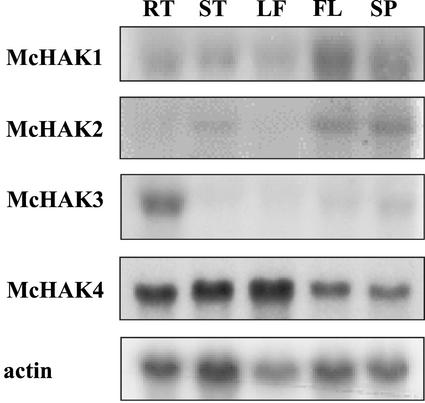
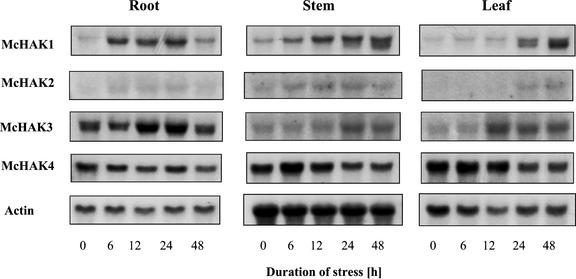
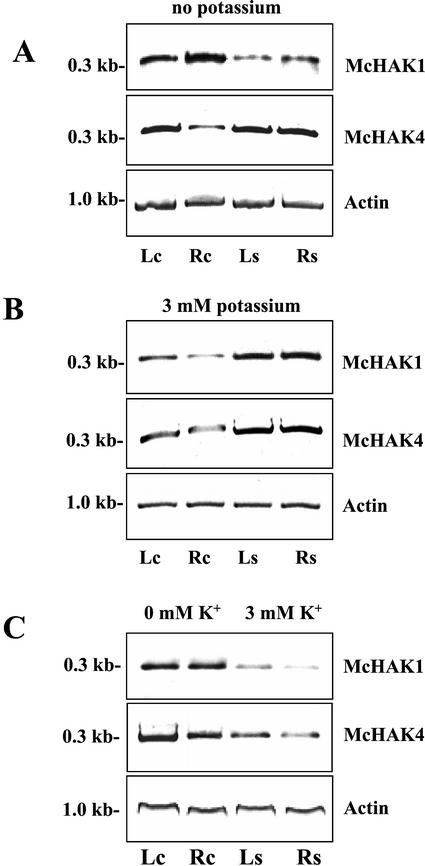
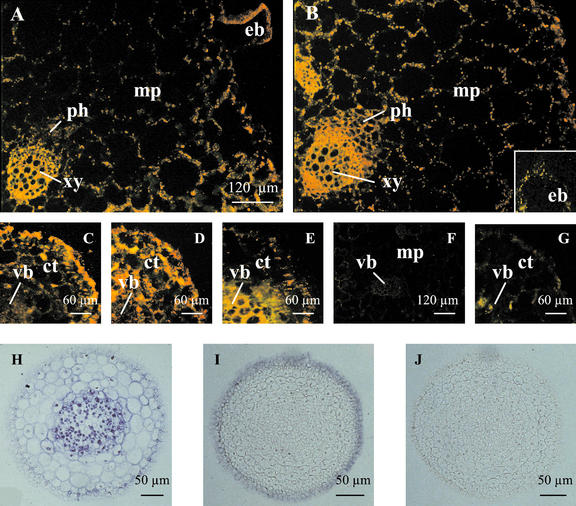
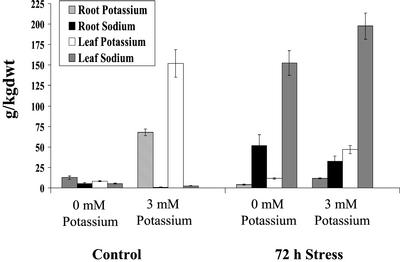
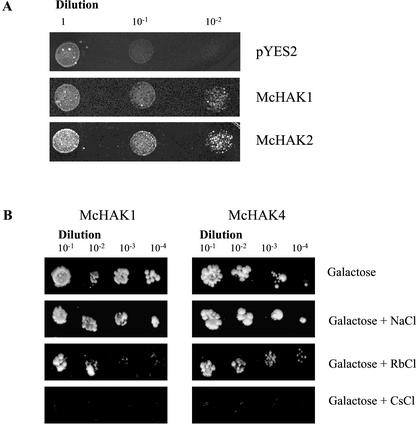
Four transcripts homologous to K(+) transporters of the HAK/KT/KUP family have been characterized from the common ice plant (Mesembryanthemum crystallinum). We report tissue-specific expression of McHAK1 and McHAK4 transcripts abundant in roots, leaves, and stems. McHAK2 was predominantly present in stems and McHAK3 in root tissues. By in situ hybridizations, the McHAKs showed signals in the leaf vascular bundles, mesophyll, and epidermal cells as well as in epidermal bladder cells. In mature roots, transcripts were mainly localized to the vasculature, and in differentiated root tips, the strongest signals were obtained from the epidermis. Expression of McHAK1, McHAK2, and McHAK4 complemented a yeast mutant defective in low- and high-affinity K(+) uptake. Growth of the yeast mutant was restored at low-millimolar K(+) concentrations and was inhibited by Rb(+) and Cs(+) but was not affected by Na(+). Transcript levels of McHAK1 and McHAK4 increased by K(+) starvation and by salt stress of 400 mM NaCl in leaves and roots. Expression of McHAK2 and McHAK3 was stimulated in leaves and was transiently induced in roots in response to high salinity with prestress transcript levels restored in salt-adapted plants. We discuss possible roles for such transporters in ion homeostasis at high salinity.
Figures
Similar articles
-
Tissue-specific expression and functional complementation of a yeast potassium-uptake mutant by a salt-induced ice plant gene mcSKD1.Plant Mol Biol. 2004 Apr;54(6):881-93. doi: 10.1007/s11103-004-0335-7. Plant Mol Biol. 2004. PMID: 15604658
-
Na+/myo-inositol symporters and Na+/H+-antiport in Mesembryanthemum crystallinum.Plant J. 2000 Nov;24(4):511-22. doi: 10.1046/j.1365-313x.2000.00903.x. Plant J. 2000. PMID: 11115132
-
Expression of the cation transporter McHKT1 in a halophyte.Plant Mol Biol. 2003 Jul;52(5):967-80. doi: 10.1023/a:1025445612244. Plant Mol Biol. 2003. PMID: 14558658
-
Plant HAK/KUP/KT K+ transporters: Function and regulation.Semin Cell Dev Biol. 2018 Feb;74:133-141. doi: 10.1016/j.semcdb.2017.07.009. Epub 2017 Jul 13. Semin Cell Dev Biol. 2018. PMID: 28711523 Review.
-
Plant KT/KUP/HAK potassium transporters: single family - multiple functions.Ann Bot. 2007 Jun;99(6):1035-41. doi: 10.1093/aob/mcm066. Epub 2007 May 11. Ann Bot. 2007. PMID: 17495982 Free PMC article. Review.
Cited by
-
Tissue-specific expression and functional complementation of a yeast potassium-uptake mutant by a salt-induced ice plant gene mcSKD1.Plant Mol Biol. 2004 Apr;54(6):881-93. doi: 10.1007/s11103-004-0335-7. Plant Mol Biol. 2004. PMID: 15604658
-
Functional analysis of McSnRK1 (SNF1-related protein kinase 1) in regulating Na/K homeostasis in transgenic cultured cells and roots of halophyte Mesembryanthemum crystallinum.Plant Cell Rep. 2019 Aug;38(8):915-926. doi: 10.1007/s00299-019-02412-2. Epub 2019 Apr 29. Plant Cell Rep. 2019. PMID: 31037366
-
A novel plant leucine-rich repeat receptor kinase regulates the response of Medicago truncatula roots to salt stress.Plant Cell. 2009 Feb;21(2):668-80. doi: 10.1105/tpc.108.059576. Epub 2009 Feb 24. Plant Cell. 2009. PMID: 19244136 Free PMC article.
-
Regulation of potassium transport in leaves: from molecular to tissue level.Ann Bot. 2003 Nov;92(5):627-34. doi: 10.1093/aob/mcg191. Epub 2003 Sep 19. Ann Bot. 2003. PMID: 14500326 Free PMC article. Review.
-
Transcriptome-wide identification and expression analysis of the KT/HAK/KUP family in Salicornia europaea L. under varied NaCl and KCl treatments.PeerJ. 2022 Mar 3;10:e12989. doi: 10.7717/peerj.12989. eCollection 2022. PeerJ. 2022. PMID: 35261820 Free PMC article.
References
-
- Amtmann A, Sanders D. Mechanisms of Na+uptake by plant cells. Adv Bot Res. 1999;29:75–112.
-
- Blumwald E, Aharon GS, Apse MP. Sodium transport in plant cells. Biochim Biophys Acta. 2000;1465:140–151. - PubMed
-
- Box S, Schachtman DP. The effect of low concentrations of sodium on potassium uptake and growth of wheat. Aust J Plant Physiol. 2000;27:175–182.
Publication types
MeSH terms
Substances
Associated data
- Actions
- Actions
- Actions
LinkOut - more resources
Full Text Sources
Other Literature Sources
Medical
