A thapsigargin-sensitive Ca(2+) pump is present in the pea Golgi apparatus membrane
- PMID: 12177495
- PMCID: PMC166770
- DOI: 10.1104/pp.002055
A thapsigargin-sensitive Ca(2+) pump is present in the pea Golgi apparatus membrane
Abstract
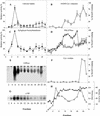
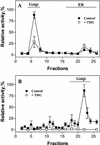
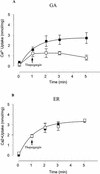
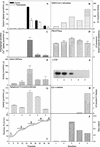
The Golgi apparatus behaves as a bona fide Ca(2+) store in animal cells and yeast (Saccharomyces cerevisiae); however, it is not known whether this organelle plays a similar role in plant cells. In this work, we investigated the presence of an active Ca(2+) accumulation mechanism in the plant cell Golgi apparatus. Toward this end, we measured Ca(2+) uptake in subcellular fractions isolated from the elongating zone of etiolated pea (Pisum sativum) epicotyls. Separation of organelles using sucrose gradients showed a strong correlation between the distribution of an ATP-dependent Ca(2+) uptake activity and the Golgi apparatus marker enzyme, xyloglucan-fucosyltransferase. The kinetic parameters obtained for this activity were: the rate of maximum Ca(2+) uptake of 2.5 nmol mg min(-1) and an apparent K(m) for Ca(2+) of 209 nM. The ATP-dependent Ca(2+) uptake was strongly inhibited by vanadate (inhibitor concentration causing 50% inhibition [I(50)] = 126 microM) and cyclopiazonic acid (I(50) = 0.36 nmol mg protein(-1)) and was not stimulated by calmodulin (1 microM). Addition of Cd(2+) and Cu(2+) at nanomolar concentration inhibited the Ca(2+) uptake, whereas Mn(2+), Fe(2+), and Co(2+) had no significant effect. Interestingly, the active calcium uptake was inhibited by thapsigargin (apparent I(50) = 88 nM), a well-known inhibitor of the endoplasmic reticulum and Golgi sarco-endoplasmic reticulum Ca(2+) ATPase from mammalian cells. A thapsigargin-sensitive Ca(2+) uptake activity was also detected in a cauliflower (Brassica oleracea) Golgi-enriched fraction, suggesting that other plants may also possess thapsigargin-sensitive Golgi Ca(2+) pumps. To our knowledge, this is the first report of a plant Ca(2+) pump activity that shows sensitivity to low concentrations of thapsigargin.
Figures


Similar articles
-
Kinetic characterization of calcium uptake by the rat liver Golgi apparatus.Cell Biol Int. 2000;24(4):229-33. doi: 10.1006/cbir.2000.0496. Cell Biol Int. 2000. PMID: 10816324
-
Involvement of thapsigargin- and cyclopiazonic acid-sensitive pumps in the rescue of TMEM165-associated glycosylation defects by Mn2.FASEB J. 2019 Feb;33(2):2669-2679. doi: 10.1096/fj.201800387R. Epub 2018 Oct 11. FASEB J. 2019. PMID: 30307768
-
Thapsigargin-sensitive Ca(2+)-ATPases account for Ca2+ uptake to inositol 1,4,5-trisphosphate-sensitive and caffeine-sensitive Ca2+ stores in adrenal chromaffin cells.Biochem J. 1995 May 1;307 ( Pt 3)(Pt 3):749-58. doi: 10.1042/bj3070749. Biochem J. 1995. PMID: 7741706 Free PMC article.
-
Regulation of endoplasmic reticulum-Ca-ATPase by glycolysis in eukaryotic cells.Miner Electrolyte Metab. 1996;22(5-6):318-35. Miner Electrolyte Metab. 1996. PMID: 8933503 Review.
-
The Ca2+/Mn2+ pumps in the Golgi apparatus.Biochim Biophys Acta. 2004 Dec 6;1742(1-3):103-12. doi: 10.1016/j.bbamcr.2004.08.018. Biochim Biophys Acta. 2004. PMID: 15590060 Review.
Cited by
-
When isolated at full receptivity, in vitro fertilized wheat (Triticum aestivum, L.) egg cells reveal [Ca2+]cyt oscillation of intracellular origin.Int J Mol Sci. 2014 Dec 19;15(12):23766-91. doi: 10.3390/ijms151223766. Int J Mol Sci. 2014. PMID: 25535074 Free PMC article.
-
AtUTr2 is an Arabidopsis thaliana nucleotide sugar transporter located in the Golgi apparatus capable of transporting UDP-galactose.Planta. 2005 Oct;222(3):521-9. doi: 10.1007/s00425-005-1557-x. Epub 2005 May 13. Planta. 2005. PMID: 15891899
-
Mechanisms and concepts paving the way towards a complete transport cycle of plant vacuolar sorting receptors.Plant Cell. 2012 May;24(5):1714-32. doi: 10.1105/tpc.112.095679. Epub 2012 May 8. Plant Cell. 2012. PMID: 22570446 Free PMC article. Review.
-
Dissecting blue light signal transduction pathway in leaf epidermis using a pharmacological approach.Planta. 2015 Oct;242(4):813-27. doi: 10.1007/s00425-015-2316-2. Epub 2015 May 13. Planta. 2015. PMID: 25968467
-
Rapid accumulation and metabolism of polyphosphoinositol and its possible role in phytoalexin biosynthesis in yeast elicitor-treated Cupressus lusitanica cell cultures.Planta. 2004 May;219(1):121-31. doi: 10.1007/s00425-003-1198-x. Epub 2004 Jan 28. Planta. 2004. PMID: 14747948
References
-
- Boevink P, Oparka K, Santa Cruz S, Martin B, Betteridge A, Hawes C. Stacks on tracks: The plant Golgi apparatus traffics on an actin/ER network. Plant J. 1998;15:441–447. - PubMed
-
- Briskin DP, Leonard RT, Hodges TK. Isolation of the plasma membrane: membrane markers and general principles. Methods Enzymol. 1987;148:542–558.
Publication types
MeSH terms
Substances
LinkOut - more resources
Full Text Sources
Research Materials
Miscellaneous

