. 2002 Aug 15;543(Pt 1):317-26.
doi: 10.1113/jphysiol.2002.017673.

The mechanisms of interhemispheric inhibition in the human motor cortex

Affiliations

The mechanisms of interhemispheric inhibition in the human motor cortex

Zafiris J Daskalakis et al. J Physiol. .

Abstract

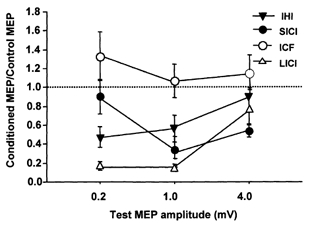
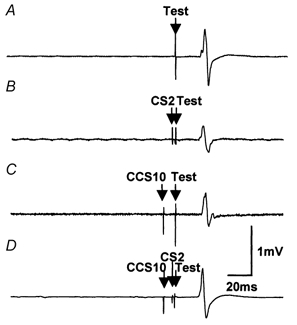
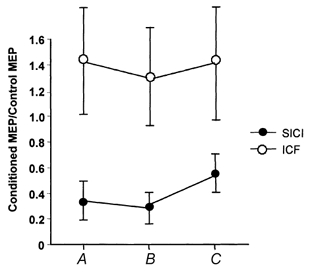
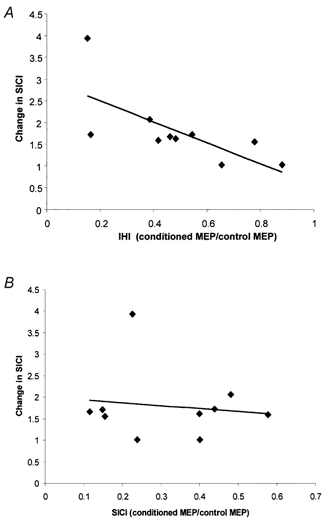
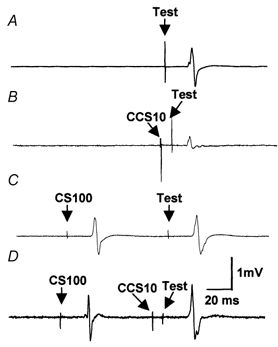
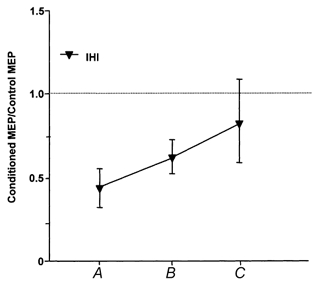
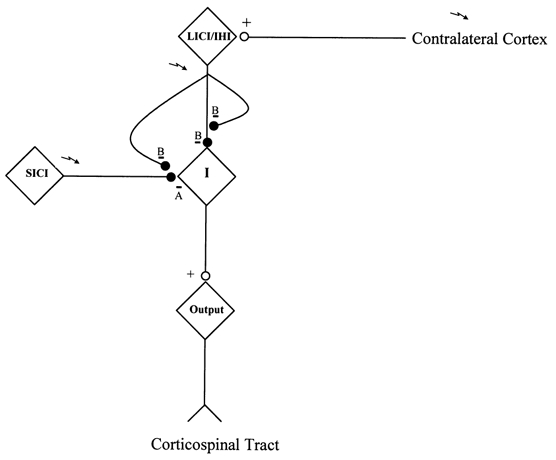
Transcranial magnetic stimulation can be used to non-invasively study inhibitory processes in the human motor cortex. Interhemispheric inhibition can be measured by applying a conditioning stimulus to the motor cortex resulting in inhibition of the contralateral motor cortex. Transcranial magnetic stimulation can also be used to demonstrate ipsilateral cortico-cortical inhibition in the motor cortex. At least two different ipsilateral cortico-cortical inhibitory processes have been identified: short interval intracortical inhibition and long interval intracortical inhibition. However, the relationship between interhemispheric inhibition and ipsilateral cortico-cortical inhibition remains unclear. This study examined the relationship between interhemispheric inhibition, short interval intracortical inhibition and long interval intracortical inhibition. First, the effect of test stimulus intensity on each inhibitory process was studied. Second, the effects of interhemispheric inhibition on short interval intracortical inhibition and long interval intracortical inhibition on interhemispheric inhibition were examined. Motor evoked potentials were recorded from the right first dorsal interosseous muscle in 11 right-handed healthy volunteers. For interhemispheric inhibition, conditioning stimuli were applied to the right motor cortex and test stimuli to the left motor cortex. For short interval intracortical inhibition and long interval intracortical inhibition, both conditioning stimuli and test stimuli were applied to the left motor cortex. With increasing test stimulus intensities, long interval intracortical inhibition and interhemispheric inhibition decreased, while short interval intracortical inhibition increased. Moreover, short interval intracortical inhibition was significantly reduced in the presence of interhemispheric inhibition. Interhemispheric inhibition was significantly reduced in the presence of long interval intracortical inhibition when matched for test motor evoked potential amplitude but the difference was not significant when matched for test pulse intensity. These findings suggest that both interhemispheric inhibition and long interval intracortical inhibition are predominately mediated by low threshold cortical neurons and may share common inhibitory mechanisms. In contrast, the mechanisms mediating short interval intracortical inhibition are probably different from those mediating long interval intracortical inhibition and interhemispheric inhibition although these systems appear to interact.


Figures

Figure 1
Figure 1. Effects of increasing TS intensity on cortical inhibition and facilitation
Data from 11 subjects. Each measure is expressed as a ratio (mean ± s.e.m.) of the conditioned MEP amplitude to the unconditioned MEP amplitude. Values below 1 indicate inhibition, greater than 1 indicate facilitation. With increasing TS intensity SICI increased whereas LICI and IHI decreased. ICF showed no significant change.
Figure 2
Figure 2. Effects of IHI on SICI in a single subject
These traces represent the averaged waveform form a single subject. In all traces the TS intensity was adjusted to produce 1 mV MEPs when preceded by a CCS10 (i.e. TS 1 mVCCS10). A, response to TS 1 mVCCS10 alone (condition 2E). B, SICI alone: The conditioning stimulus (CS2) inhibited the test MEP (condition 2F) compared to A. C, IHI alone: The contralateral conditioning stimulus (CCS10) also inhibited the test response (condition 2H) compared to A. D, combined IHI and SICI: When the CCS10 preceded the CS2 (condition 2I), CS2 led to facilitation rather than inhibition of the test MEP compared to C.
Figure 3
Figure 3. Effects of IHI on SICI and ICF
Data from 10 subjects. Both inhibition and facilitation are expressed as a ratio (mean ± s.e.m.) of the conditioned MEP amplitude to the unconditioned MEP amplitude. Values greater than one represent facilitation whereas values less than one represent inhibition. Points above A represent SICI and ICF using a TS that evokes a 1 mV MEP (i.e. TS 1 mV) (conditions 2B/2A and 2C/2A) and points above B represent SICI and ICF with a TS that evokes a 1 mV MEP if preceded by a CCS10 stimulus (i.e. TS 1 mVCCS10) (condition 2F/2E and 2G/2E). Points above C demonstrate the triple stimulus approach in which a CS2 or CS10 are preceded by CCS10 (2I/2H and 2J/2H). Here the test stimulus was TS 1 mVCCS10 (condition 2H). There was significantly less SICI in the presence of IHI (C) compared to SICI in the absence of IHI (A and B). ICF was not significantly changed by IHI.
Figure 4
Figure 4. Effects of the strengths of IHI and SICI on IHI-SICI interaction
Data from 10 subjects and each point represents one subject. A, the relationship between IHI and the change in SICI in the presence of IHI. IHI is expressed as a ratio of the conditioned MEP amplitude to the unconditioned MEP amplitude (2H/2E). The y-axis represents a ratio of the SICI in the presence of IHI (2I/2H) to SICI alone (2F/2E). Change in SICI was significantly correlated with the strength of IHI. B, the relationship between SICI and the change in SICI in the presence of IHI. SICI is expressed as a ratio of the conditioned MEP amplitude to the unconditioned MEP amplitude (2H/2E). The y-axis represents a ratio of the SICI in the presence of IHI (2I/2H) to SICI alone (2F/2E). There was no correlation.
Figure 5
Figure 5. Effects of LICI on IHI in a single subject
Traces represent the averaged waveform for a single subject. A, response to TS 1 mV alone (condition 3A). B, IHI alone: A contralateral conditioning stimulus (CCS10) inhibited the test response (condition 3B) compared to A. The TS was the same as in A. C. LICI alone: A conditioning stimulus (CS100) using a TS that evokes a 1 mV MEP if preceded by a CS100 stimulus (i.e. TS 1 mVCS100; condition 3F). The test MEP amplitude here is matched with that in A. D, combined LICI and IHI (condition 3G): In the presence of CS100, the CCS10 pulse caused no inhibition but a slight MEP facilitation compared to that shown in C.
Figure 6
Figure 6. Effects of LICI on IHI
Data from 11 subjects. Inhibition is expressed as a ratio of the conditioned MEP amplitude to the unconditioned MEP amplitude (mean ± s.e.m.). Values less than one represent inhibition. A, IHI using a TS that evokes a 1 mV MEP (i.e. TS 1 mV) (condition 3B/3A). B, IHI using a TS that evokes a 1 mV MEP if preceded by a CS100 stimulus (i.e. TS 1 mVCS100) (condition 3E/3D). C, the triple stimulus approach in which a CCS10 is preceded by a CS100 conditioning stimulus (3G/3F). Here the test stimulus was TS 1 mVCS100 (3F). IHI was less for the TS 1 mVCS100 (B) than the lower TS 1 mV (A). In the presence of LICI, IHI was significantly reduced when matched for TS 1 mV (A vs. B) but not when matched for TS 1 mVCS100 (B vs. C).
Figure 7
Figure 7. A hypothesis to explain our experimental findings
Each diamond schematically represents a population of neurons mediating the SICI, LICI, IHI or the motor response to test stimulus alone. The diamond labelled ‘I’ represents cells leading to descending I-waves and ‘output’ represents corticospinal output neurons. Filled circles represent inhibitory synapses and open circles represent excitatory synapses. ‘Bolts’ represent the presumed site of TMS stimulation. The letters ‘A’ and ‘B’ indicates the predominance of GABA receptor subtypes A or B. It is hypothesized that IHI is due to excitatory input from the contralateral motor cortex which activates inhibitory neurons that also mediate LICI (LICI/IHI). They cause MEP inhibition via postsynaptic GABAB receptors and cause auto-inhibition and inhibition of SICI via presynaptic GABAB receptors.

References

    1. Asanuma H, Okuda O. Effects of transcallosal volleys on pyramidal tract cell activity of cat. Journal of Neurophysiology. 1962;25:198–208. - PubMed
    1. Awiszus F, Feistner H, Urbach D, Bostock H. Characterisation of paired-pulse transcranial magnetic stimulation conditions yielding intracortical inhibition or I-wave facilitation using a threshold-hunting paradigm. Experimental Brain Research. 1999;129:317–324. - PubMed
    1. Berlucci G. Commisurotomy studies in animals. In: Boller F, Grafman J, editors. Handbook of Neuropsychology. Vol. 4. Amsterdam: Elsevier; 1990. pp. 9–47.
    1. Chang HT. Cortical response to activity of callosal neurons. Journal of Neurophysiology. 1953;16:117–131. - PubMed
    1. Chen R, Garg R. Facilitatory I wave interaction in proximal arm and lower limb muscle representations of the human motor cortex. Journal of Neurophysiology. 2000;83:1426–1434. - PubMed

Publication types

LinkOut - more resources