. 2002 Aug;13(8):2783-94.
doi: 10.1091/mbc.e02-02-0075.

Dissection of transient oxidative stress response in Saccharomyces cerevisiae by using DNA microarrays

Affiliations

Dissection of transient oxidative stress response in Saccharomyces cerevisiae by using DNA microarrays

Marian Groot Koerkamp et al. Mol Biol Cell. 2002 Aug.

Abstract

Yeast cells were grown in glucose-limited chemostat cultures and forced to switch to a new carbon source, the fatty acid oleate. Alterations in gene expression were monitored using DNA microarrays combined with bioinformatics tools, among which was included the recently developed algorithm REDUCE. Immediately after the switch to oleate, a transient and very specific stress response was observed, followed by the up-regulation of genes encoding peroxisomal enzymes required for fatty acid metabolism. The stress response included up-regulation of genes coding for enzymes to keep thioredoxin and glutathione reduced, as well as enzymes required for the detoxification of reactive oxygen species. Among the genes coding for various isoenzymes involved in these processes, only a specific subset was expressed. Not the general stress transcription factors Msn2 and Msn4, but rather the specific factor Yap1p seemed to be the main regulator of the stress response. We ascribe the initiation of the oxidative stress response to a combination of poor redox flux and fatty acid-induced uncoupling of the respiratory chain during the metabolic reprogramming phase.


Figures
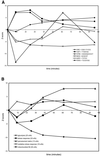
Figure 1
Figure 1
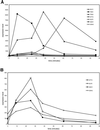
Dissection of the transcriptional response of yeast cells to a shift from glucose to oleate as new carbon source as analyzed by DNA microarrays and three bioinformatics tools. (A) REDUCE analysis of the oleate induction time course. The log-ratios data set of an oleate induction time course were correlated with DNA sequence elements in promoter regions using the program REDUCE. Six relevant regulatory motifs are shown. Complete results are available at http://bussemaker.bio.columbia.edu/papers/oleate. (B) QUONTOLOGY analysis of the same oleate induction time course. Time courses corresponding to the average log-ratio for genes in five significantly changing functional categories from Gene Ontology. (C) Hierarchical clustering of expression profiles for genes whose expression changed significantly. Three time-course experiments were analyzed: one oleate induction experiment with double RNA isolations (OP1 and OP2), and one independent oleate induction experiment from a separate chemostat (OP3). All datasets were gathered and filtered as described in MATERIALS AND METHODS. Filtering resulted in 269 significantly regulated genes (more than twofold induced or repressed). This set was used as input for GeneMaths (www.applied-maths.com) to perform Euclidian correlation combined with UPGMA clustering. Enlarged are 1) an early up-regulated cluster, containing many Yap1-regulated genes (red squares) or containing a Yap1-control element (TTASTAA); and 2) a cluster containing peroxisomal matrix genes (green squares) and/or an ORE element. Also, down-regulation of glycolysis, the significance of a (promoter) element with unknown function (CGATGAG) and STRE elements (AAGGGG) are indicated.
Figure 1
Figure 1
Dissection of the transcriptional response of yeast cells to a shift from glucose to oleate as new carbon source as analyzed by DNA microarrays and three bioinformatics tools. (A) REDUCE analysis of the oleate induction time course. The log-ratios data set of an oleate induction time course were correlated with DNA sequence elements in promoter regions using the program REDUCE. Six relevant regulatory motifs are shown. Complete results are available at http://bussemaker.bio.columbia.edu/papers/oleate. (B) QUONTOLOGY analysis of the same oleate induction time course. Time courses corresponding to the average log-ratio for genes in five significantly changing functional categories from Gene Ontology. (C) Hierarchical clustering of expression profiles for genes whose expression changed significantly. Three time-course experiments were analyzed: one oleate induction experiment with double RNA isolations (OP1 and OP2), and one independent oleate induction experiment from a separate chemostat (OP3). All datasets were gathered and filtered as described in MATERIALS AND METHODS. Filtering resulted in 269 significantly regulated genes (more than twofold induced or repressed). This set was used as input for GeneMaths (www.applied-maths.com) to perform Euclidian correlation combined with UPGMA clustering. Enlarged are 1) an early up-regulated cluster, containing many Yap1-regulated genes (red squares) or containing a Yap1-control element (TTASTAA); and 2) a cluster containing peroxisomal matrix genes (green squares) and/or an ORE element. Also, down-regulation of glycolysis, the significance of a (promoter) element with unknown function (CGATGAG) and STRE elements (AAGGGG) are indicated.
Figure 2
Figure 2
GFP-Yap1p and GFP-Msn2p localization after oleate induction. A yeast strain containing an integrated copy of GFP-Yap1p (A) and GFP-Msn2p (B) was subjected to glucose-limited growth in a chemostat, followed by oleate induction. At indicated times samples were taken and immediately inspected under a fluorescence microscope and photographed. A full oxidative stress response for Yap1p is shown in panel CCCP in which cells were treated with the uncoupler CCCP.
Figure 3
Figure 3
Components of the redox/ROS stress response. Isoenzymes are shown that are possibly involved in maintaining cellular redox balance and detoxification of ROS.
Figure 4
Figure 4
Expression of individual redox genes in oleate induction. Absolute expression levels of selected redox genes were taken from the microarray data of an oleate induction time course (A). POT1 was included as a marker for peroxisomal induction. Glutathione-related genes show 10-fold lower expression levels (B).
Figure 5
Figure 5
Expression of ROS genes after oleate addition. Absolute expression levels of selected ROS genes were taken from the microarray results. POT1 was taken as a marker of peroxisome induction.
Figure 6
Figure 6
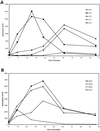
REDUCE analysis of a glucose-stop time course, performed as control for the oleate-response experiment presented in Figure 1. Activity profiles are shown here for the six promoter elements in Figure 1A.
Figure 7
Figure 7
RNA levels of indicative genes for peroxisome induction and stress-response are plotted from time courses of 0.12% oleate addition (A), 0.0002% oleate addition (B), and the glucose stop experiment (C).

References

    1. Ashburner M, et al. Gene ontology: tool for the unification of biology. Nat Genet. 2000;25:25–29. - PMC - PubMed
    1. Baumgartner U, Hamilton B, Piskacek M, Ruis H, Rottensteiner H. Functional analysis of the Zn2Cys6 transcription factors Oaf1p and Pip2p. J Biol Chem. 1999;274:22208–22216. - PubMed
    1. Beck T, Hall MN. The TOR signaling pathway controls nuclear localization of nutrient-regulated transcription factors. Nature. 1999;402:689–692. - PubMed
    1. Beevers H. Glyoxysomes of castor bean endosperm and their relation to gluconeogenesis. Ann NY Acad Sci. 1969;168:313–324. - PubMed
    1. Boy-Marcotte E, Perrot M, Bussereau F, Boucherie H, Jacquet M. Msn2p and Msn4p control a large number of genes induced at the diauxic transition which are repressed by cyclic AMP in Saccharomyces cerevisiae. J Bacteriol. 1998;180:1044–1052. - PMC - PubMed

Publication types

MeSH terms

LinkOut - more resources