. 2002 Sep;9(9):934-44.
doi: 10.1038/sj.cdd.4401048.

Release of cytochrome c and activation of pro-caspase-9 following lysosomal photodamage involves Bid cleavage

Affiliations

Release of cytochrome c and activation of pro-caspase-9 following lysosomal photodamage involves Bid cleavage

J J Reiners Jr et al. Cell Death Differ. 2002 Sep.

Abstract

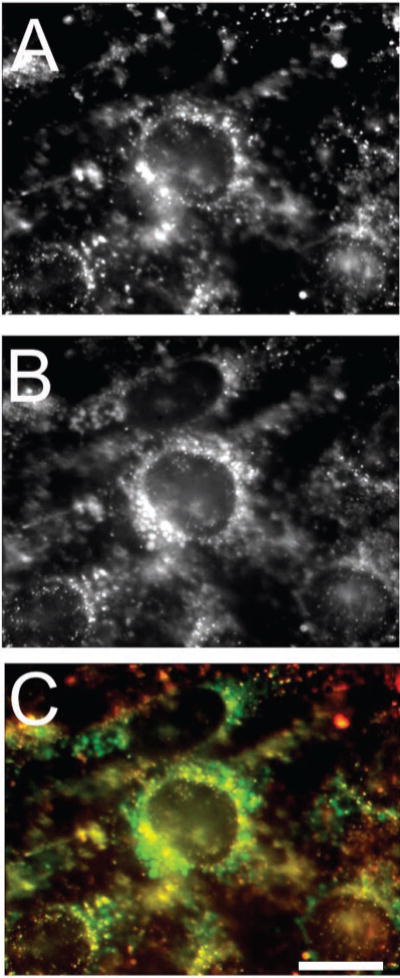
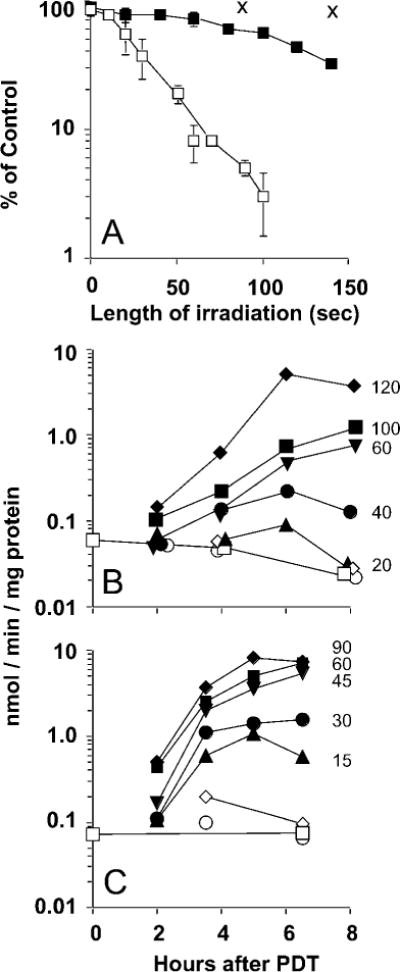
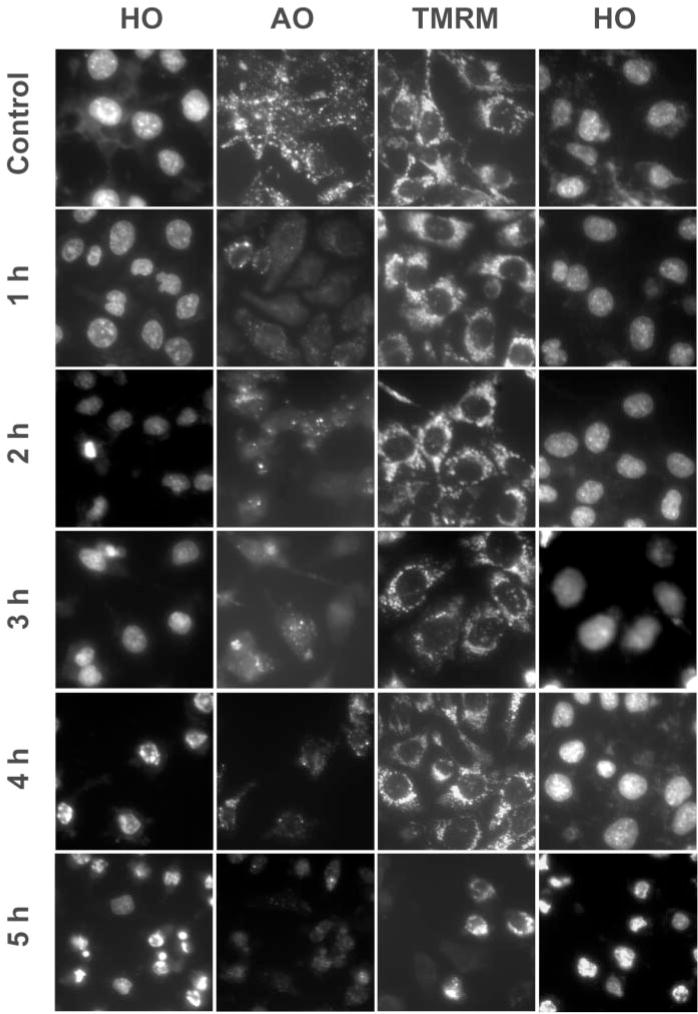
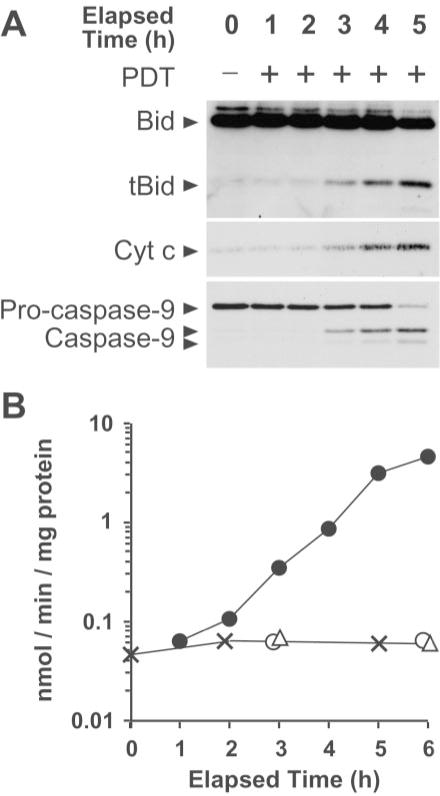
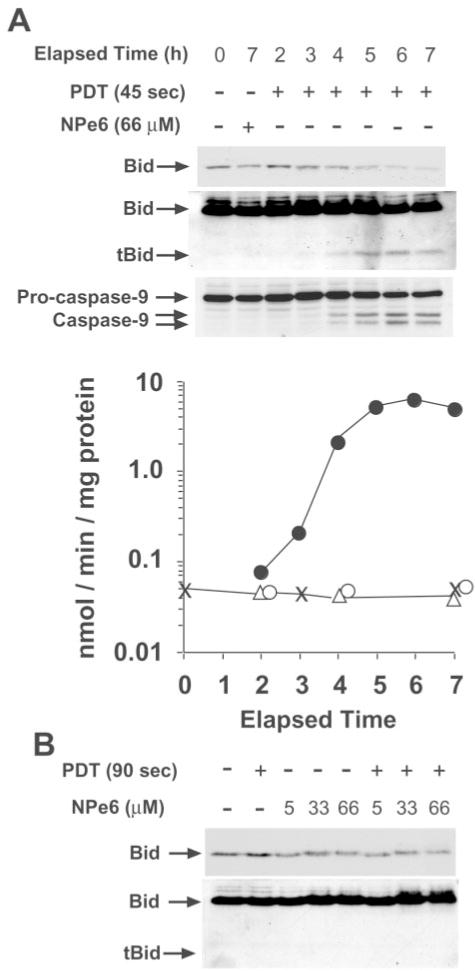
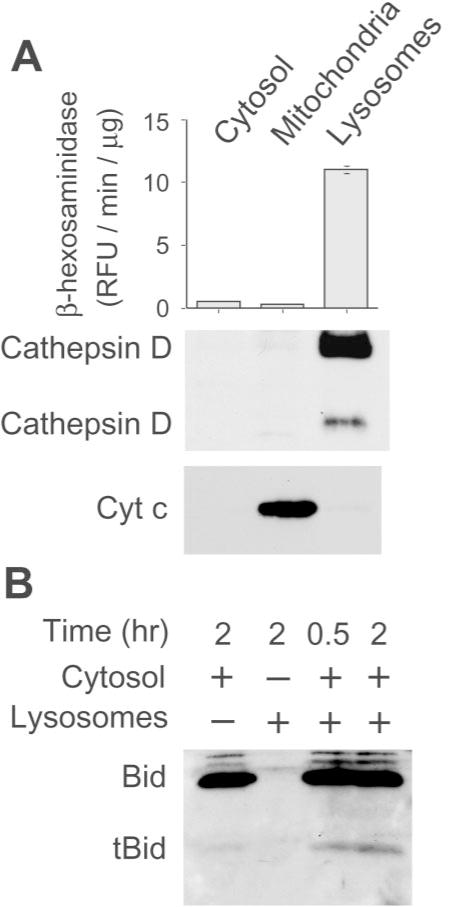
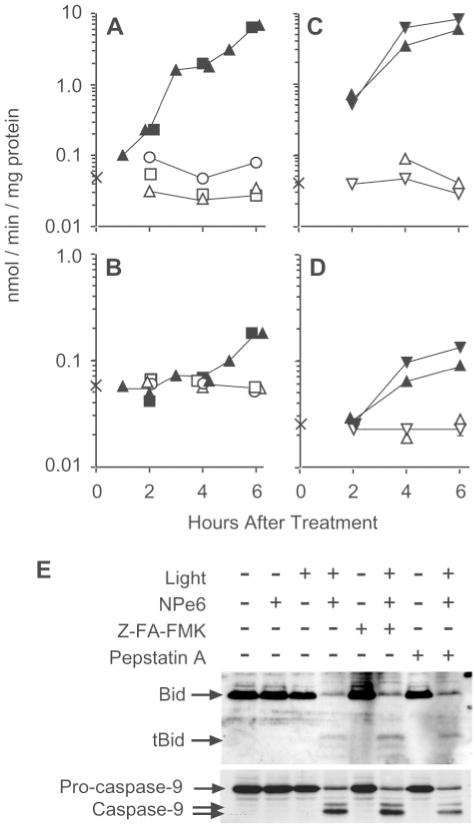
Photodynamic therapy (PDT) protocols employing lysosomal sensitizers induce apoptosis via a mechanism that causes cytochrome c release prior to loss of mitochondrial membrane potential (DeltaPsi(m)). The current study was designed to determine how lysosomal photodamage initiates mitochondrial-mediated apoptosis in murine hepatoma 1c1c7 cells. Fluorescence microscopy demonstrated that the photosensitizer N-aspartyl chlorin e6 (NPe6) localized to the lysosomes. Irradiation of cultures preloaded with NPe6 induced the rapid destruction of lysosomes, and subsequent cleavage/activation of Bid, pro-caspases-9 and -3. Pro-caspase-8 was not activated. Release of cytochrome c occurred at about the time of Bid cleavage and preceded the loss of DeltaPsi(m). Extracts of purified lysosomes catalyzed the in vitro cleavage of cytosolic Bid, but not pro-caspase-3 activation. Pharmacological inhibition of cathepsin B, L and D activities did not suppress Bid cleavage or pro-caspases-9 and -3 activation. These studies demonstrate that photodamaged lysosomes trigger the mitochondrial apoptotic pathway by releasing proteases that activate Bid.


Figures

Figure 1
Figure 1
Localization of NPe6 in 1c1c7 cells. Cells grown on coverslips were preloaded with 66 μM NPe6 for 30 min prior to being washed, refed and loaded with LysoTracker Blue (LTB). After 10 min the cultures were washed with PBS and analyzed by fluorescence microscopy. Panels represent fluorescence of: (A) NPe6, (B) LTB, (C) merged image of NPe6+LTB. Bar represents 20 microns
Figure 2
Figure 2
Light dose and NPe6-concentration-dependent killing and activation of caspase-3 in PDT protocols. (A) 1c1c7 cells were plated at densities of 400–800 cells/60 mm dish. Approximately 16 h later cultures were loaded with 22 μM (■) or 66 μM (□) NPe6 for 45min prior to being washed, refed and irradiated for the indicated period of time. Other cultures were only irradiated (X). Colonies were counted 7–9 days after Irradiation. Data represent means ± S.D. of 3–4 plates. (B) Subconfluent, 2 day-old cultures were loaded with 22 μM NPe6 for 45 min prior to being washed, refed and Irradiated for 20–120 s (time is Indicated next to solid symbol). Cultures were harvested at various times after Irradiation for assay of caspase-3 activities. (C) Same as B except that cultures were preloaded with 66 μM NPe6. Open symbols in B and C represent: no treatment (□), light alone (◇), and NPe6 alone (○). Data in panels B and C represent means ± S.D. of triplicate assays of a single culture. One s of irradiation=1.5mJ/cm2. Similar results were obtained in a second Independent experiment
Figure 3
Figure 3
Effects of PDT with NPe6 on lysosomal integrity and mitochondrial membrane potential. Cells grown on coverslips were preloaded with 66 μM NPe6 for 30 min prior to being washed, refed and irradiated (135mJ/cm2). PDT-treated cultures were co-stained at the indicated times after irradiation with either HO+AO (first and second columns), or TMRM+HO (third and fourth columns) to visualize nuclei+lysosomes and ΔΨm+nuclei, respectively. Non-treated control cultures were treated and processed similarly. Similar results were obtained in a second independent experiment
Figure 4
Figure 4
Kinetics of Bid cleavage, cytochrome c release, and activation of pro-caspase-9 and pro-caspase-3 following high light dose irradiation of NPe6-sensitized 1c1c7 cells. Two-day-old cultures were preloaded with 66 μM NPe6 for 45 min prior to being washed, refed and irradiated (135mJ/cm2). Cultures were harvested at various times after Irradiation for analyses of: (A), Bid cleavage, cytosolic cytochrome c, and pro-caspase-9 cleavage; and (B), caspase-3 activity. Parallel cultures were either not treated, or only irradiated, or only sensitized with NPe6. Symbols in B are means ± S.D. of triplicate assays of a single culture and represent: no treatment (X); irradiation alone (△); NPe6 alone (○); and NPe6+irradiation (●). Western blot analyses used 20, 10, and 20 μg of protein per lane for Bid, cytosolic cytochrome c and caspase-9 analyses, respectively. Similar data were obtained in a second Independent study
Figure 5
Figure 5
Kinetics of Bid cleavage and pro-caspases-9 and -3 activation following low light dose irradiation of NPe6-sensitized 1c1c7 cells. (A) Two day-old cultures were preloaded with 66 μM NPe6 for 45min prior to being washed, refed and irradiated (67.5mJ/cm2). Cultures were harvested at various times after irradiation for analyses of Bid and pro-caspase-9 cleavage and caspase-3 activity. Parallel cultures were either not treated, or only irradiated, or only sensitized with NPe6. Symbols are means ± S.D. of triplicate assays of a single culture and represent: no treatment (X); irradiation alone (△); NPe6 alone (○); and NPe6+irradiation (●). (B) Cytosolic extracts were incubated in the presence of varied concentrations of NPe6 for 6 h, or irradiated for 90 s (135 mJ/cm2), and then incubated for 6 h prior to being used for analyses of Bid and tBid. Parallel cultures received varying concentrations of NPe6 prior to being irradiated and incubated an additional 6 h. Western blot analyses used 20μg of protein per lane. ECL exposure times were varied to facilitate analyses of Bid loss and tBid appearance
Figure 6
Figure 6
In vitro cleavage of Bid by lysosomal extracts. (A) Cytosol and extracts from purified lysosomes and mitochondria were assayed for β-hexosaminidase activity, and the presence of cathepsin D and cytochrome c. Western blot analyses used 20 μg of protein per lane. (B) Cytosol (20 μg) and lysosomal extract (2.5 μg) were mixed and incubated for either 30 or 120 min prior to being used in Western blot analyses. Cytosol and lysosomal extracts were incubated in parallel for 120 min prior to analyses. Western blot analyses in B used 20, 2.5 and 22.5 μg of cytosolic, lysosomal, or cytosolic+lysosomal protein, respectively. Similar results were obtained in a second experiment employing a different preparation of lysosomes and cytosol
Figure 7
Figure 7
Effects of Z-FA-FMK and pepstatin A on NPe6/PDT-induced apoptosis. Two-day-old 1c1c7 cultures were co-treated with either 1 μM Z-FA-FMK at the time of NPe6 loading (A,B,E), or treated with pepstatin A (100 units/ml) 18 h prior to NPe6 loading (C,D,E). Cultures were loaded with NPe6 for 45 min prior to being washed, refed and irradiated (180 mJ/cm2). Cultures were subsequently harvested 1–6 h after Irradiation for analyses of caspase-3 (A,C) and caspase-8 (B,D) activities. Other cultures were harvested 5 h after irradiation for Western blot analyses of Bid (E). Data in A–D represent means ± S.D. of triplicate assays of a single culture. Symbols are: no treatment (X), light (○), NPe6 (△), Z-FA-FMK (□), pepstatin A (▽), NPe6+light (▲), NPe6+ light+Z-FA-FMK (■), and NPe6+light+pepstatin A (▼). Western blot analyses used 40 μg of protein per lane. Similar results were obtained in a second independent experiment

References

    1. Dougherty TJ, Gomer CJ, Henderson BW, Jori G, Kessel D, Korbelik M, Moan J, Peng Q. Photodynamic therapy. J Natl Cancer Inst. 1998;90:889–905. - PMC - PubMed
    1. Agarwal ML, Clay ME, Harvey EJ, Evans HH, Antunex AR, Oleinick NL. Photodynamic therapy induces rapid cell death by apoptosis in L5178Y mouse lymphoma cells. Cancer Res. 1991;51:5993–5996. - PubMed
    1. Oleinick NL, Morris RL, Belichenko I. Apoptosls in response to photodynamictherapy: what, where, why and how. Photochem Photobiol Sci. 2002;1:1–21. - PubMed
    1. Noodt BB, Berg K, Stokke Q, Peng Q, Nesland JM. Different apoptotic pathways are induced from various intracellular sites by tetraphenylporphyrins and light. Br J Cancer. 1999;79:72–81. - PMC - PubMed
    1. Kessel D, Luo Y, Mathieu P, Reiners JJ., Jr Determinants of the apoptotic response to lysosomal photodamage. Photochem Photobiol. 2000;71:196–200. - PubMed

Publication types

MeSH terms