. 2002 Sep;71(3):575-84.
doi: 10.1086/342406. Epub 2002 Aug 12.

Power calculations for a general class of family-based association tests: dichotomous traits

Affiliations

Power calculations for a general class of family-based association tests: dichotomous traits

Christoph Lange et al. Am J Hum Genet. 2002 Sep.

Abstract

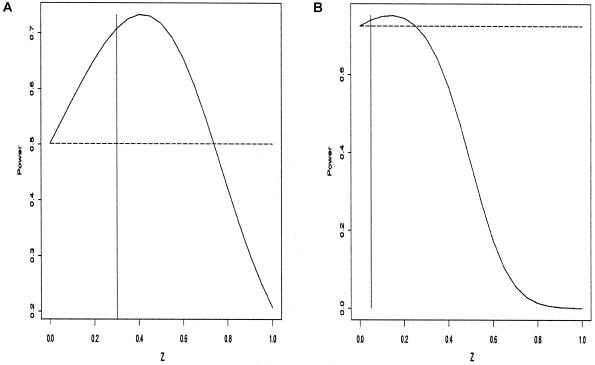
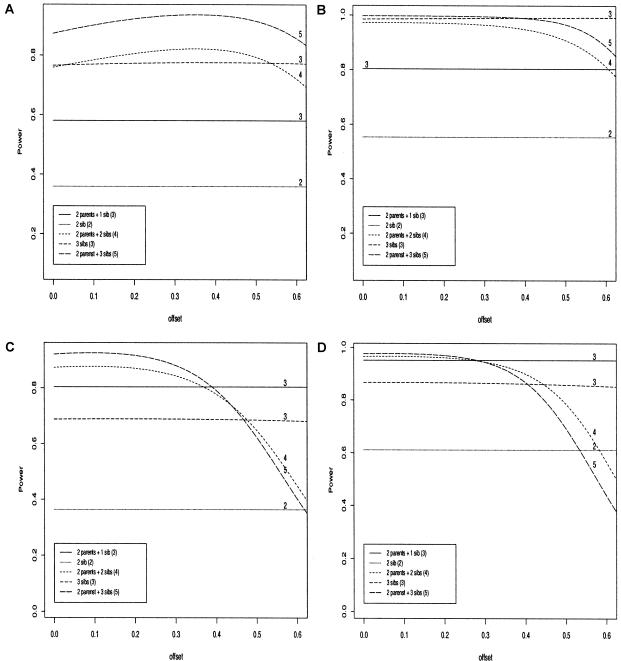
Using large-sample theory, we present a unified approach to power calculations for family-based association tests. Currently available methods for power calculations are restricted to special designs or require approximations or simulations. Our analytical approach to power calculations is broadly applicable in many settings. We discuss power calculations for two scenarios that have high practical relevance and in which power previously could only be assessed by simulation studies or by approximations: (1) studies using both affected and unaffected offspring and (2) studies with missing parental information. When the population prevalence is high, it can be worthwhile to genotype unaffected offspring. For many scenarios, high power can be achieved with reasonable sample sizes, even when no parental information is available.


Figures

Figure  1
Figure 1
Power of FBAT test for trios with one additional unaffected offspring and both parents' genotypes observed. The dotted line shows the power of the standard TDT, including only the affected offspring. The vertical line shows the location of the disease prevalence K. a, Multiplicative model for a common disease: disease prevalence K=0.3, allele frequency of the disease gene p=0.143, fraction of the disease attributable to carrying at least one disease gene AF=0.25, significance level α=0.01, and sample size 100. Optimal offset choice z=0.4. Power gain by optimal choice of z over z=0 is 25%. b, Multiplicative model for a rare disease: disease prevalence K=0.05, allele frequency of the disease gene p=0.05, fraction of the disease attributable to carrying at least one disease gene AF=0.3, significance level α=10-4, and sample sizes 100. Optimal choice of z=0.15. Power gain by optimal choice of z over z=0 is 5%.
Figure  2
Figure 2
Power of FBAT tests for multiplicative models: Significance level α=0.01. The numbers shown above the graphs correspond to the numbers of genotyped subjects in each family. a, n=200, p=0.2, K=0.3, AF=0.2. b, n=100, p=0.05, K=0.2, AF=0.2. c, n=100, p=0.05, K=0.05, AF=0.2. d, n=200, p=0.2, K=0.05, AF=0.3.

References

Electronic-Database Information

    1. FBAT Web page, http://www.biostat.harvard.edu/~fbat/default.html (for PBAT software package)

References

    1. Boehnke M, Langefeld CD (1998) Genetic association mapping based on discordant sib pairs: the discordant-alleles test. Am J Hum Genet 62:950–961 - PMC - PubMed
    1. Camp NJ (1997) Genomewide transmission/disequilibrium testing—consideration of the genotypic relative risks at disease loci. Am J Hum Genet 61:1424–1430 - PMC - PubMed
    1. Chen W-M, Deng H-W (2001) A general and accurate approach for computing the statistical power of the transmission disequilibrium test for complex disease genes. Genet Epidemiol 21:53–67 - PubMed
    1. Horvath S, Laird NM (1998) A discordant-sibship test for disequilibrium and linkage: no need for parental data. Am J Hum Genet 63:1886–1897 - PMC - PubMed
    1. Horvath S, Xu X, Laird NM (2001) The family based association test method: strategies for studying general genotype-phenotype associations. Eur J Hum Genet 9:301–306 - PubMed

Publication types

Substances