

Incidence of neural tube defects in Ontario, 1986-1999
- PMID: 12186167
- PMCID: PMC117467
Incidence of neural tube defects in Ontario, 1986-1999
Abstract
Background: Prenatal screening and the promotion of folic acid intake could affect the incidence of neural tube defects (NTDs). We examined trends in the total NTD incidence, as detected in live births, stillbirths and therapeutic abortions, from 1986 to 1999 in Ontario.
Methods: To capture cases of NTDs we used data from the Canadian Congenital Anomalies Surveillance System and hospital data on therapeutic abortions. We calculated the total incidence of NTDs by combining the numbers of NTDs occurring in live births, stillbirths and therapeutic abortions.
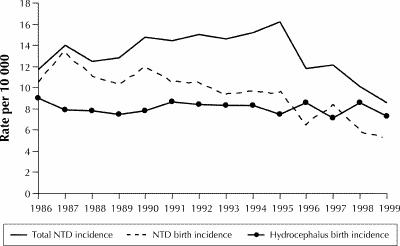
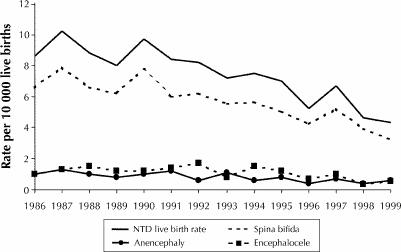
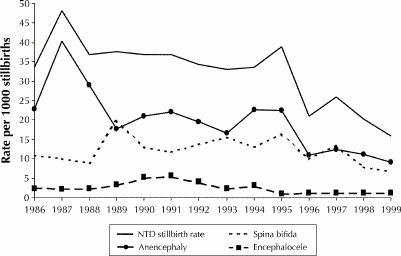
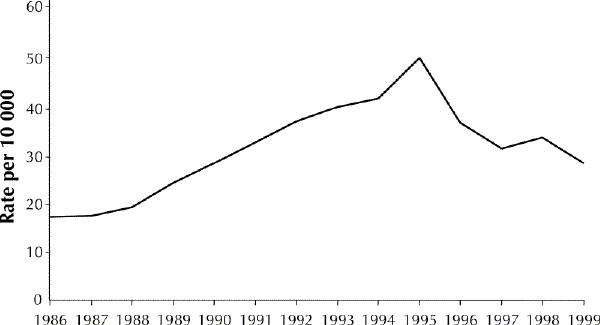
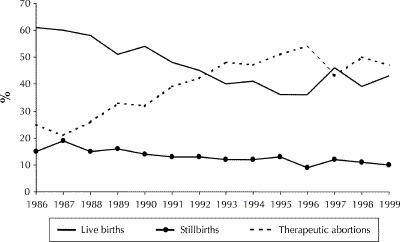
Results: The total NTD incidence rate increased from 11.7 per 10,000 pregnancies in 1986 to 16.2 per 10,000 in 1995, and it subsequently decreased to 8.6 per 10,000 by 1999. The NTD birth rate (live births and stillbirths) decreased from 10.6 per 10,000 births in 1986 to 5.3 per 10,000 in 1999. The rate of therapeutic abortions with an NTD or hydrocephalus rose from 17.5 per 10,000 abortions in 1986 to 50.7 per 10,000 in 1995 and fell to 28.7 per 10,000 abortions in 1999.
Interpretation: The total NTD incidence rate increased from 1986 to 1995, probably because of increased prenatal screening and better detection of NTDs. The decline from 1995 to 1999 may have been due to increased folic acid intake among women at the time of conception.
Figures
Comment in
-
Neural tube defects and periconceptional folic acid.CMAJ. 2002 Aug 6;167(3):255-6. CMAJ. 2002. PMID: 12186171 Free PMC article. No abstract available.
References
-
- Moore KL. The developing human: clinically oriented embryology. 3rd ed. Philadelphia: W.B. Saunders Company; 1982. p. 385-403.
-
- Canadian Perinatal Surveillance System: induced abortion [fact sheet]. Ottawa: Health Canada; 1998.
Publication types
MeSH terms
LinkOut - more resources
Full Text Sources
Medical