Comparative Study
. 2002 Jul 24;3(8):RESEARCH0038.
doi: 10.1186/gb-2002-3-8-research0038. Epub 2002 Jul 24.

Expression profiling of Drosophila imaginal discs

Affiliations
Comparative Study

Expression profiling of Drosophila imaginal discs

Ansgar Klebes et al. Genome Biol. .

Abstract

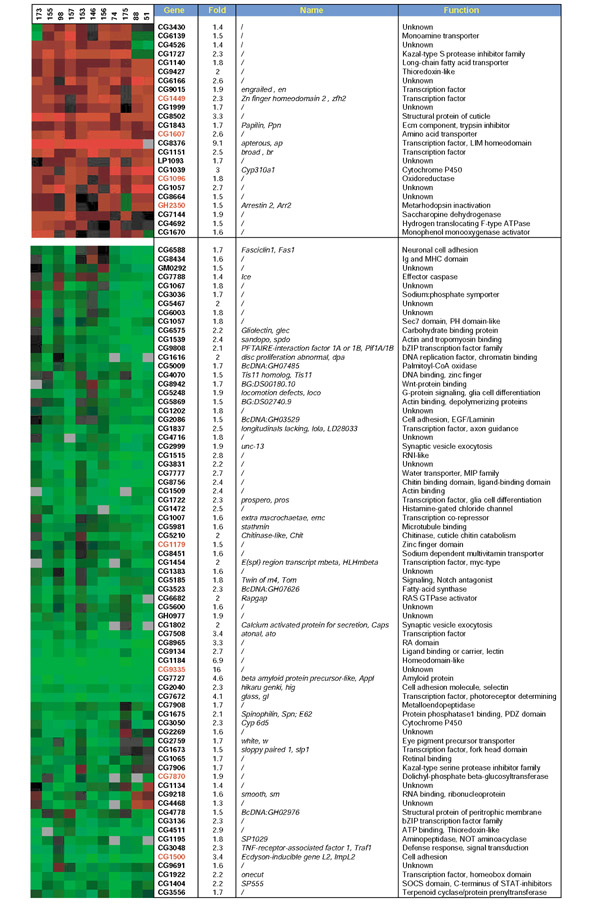
Background: In the Drosophila larva, imaginal discs are programmed to produce adult structures at metamorphosis. Although their fate is precisely determined, these organs remain largely undifferentiated in the larva. To identify genes that establish and express the different states of determination in discs and larval tissues, we used DNA microarrays to analyze mRNAs isolated from single imaginal discs.

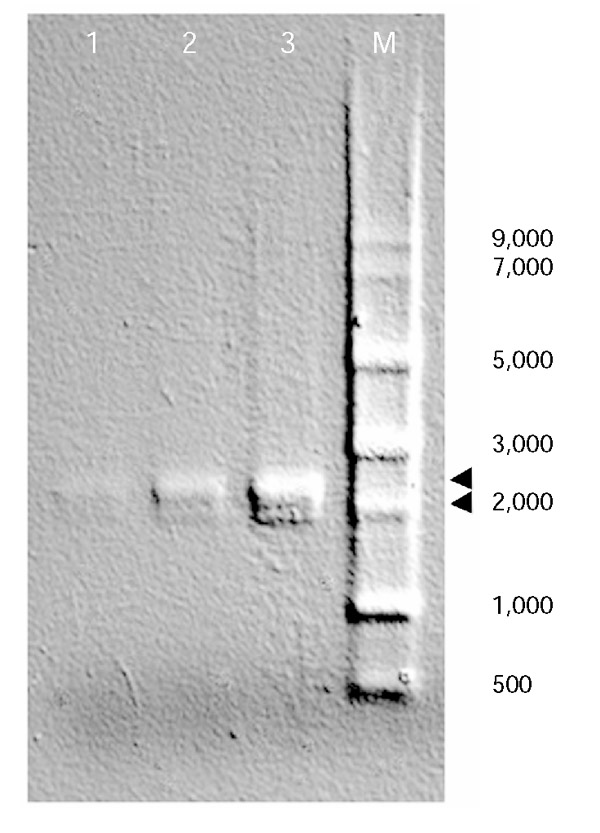
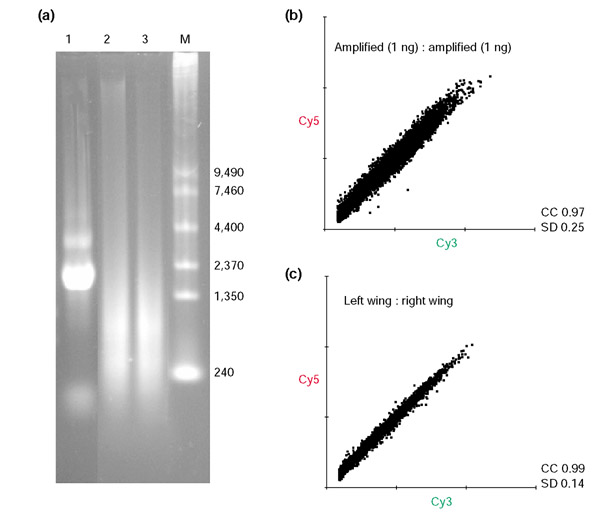
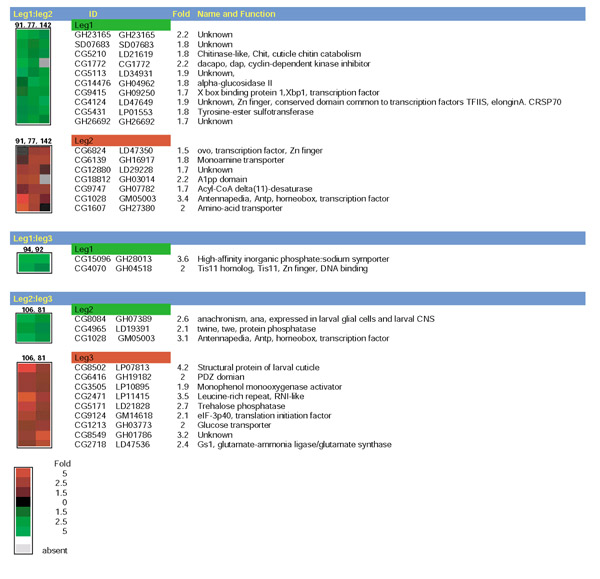
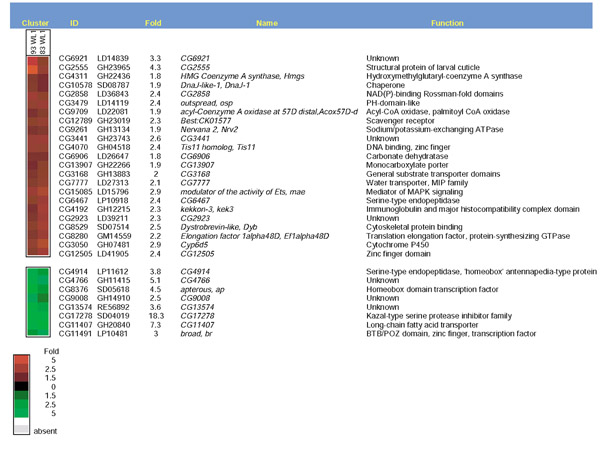
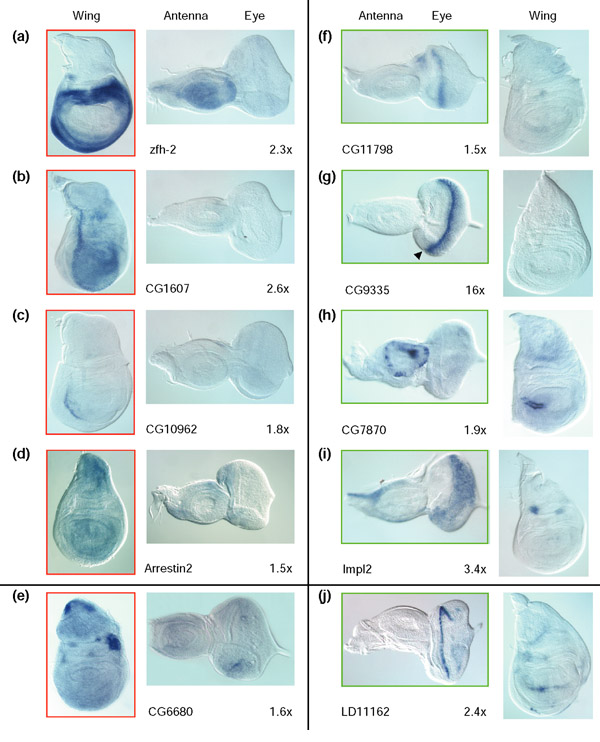
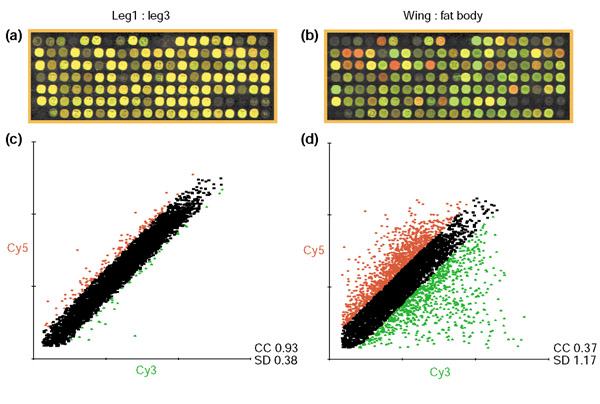
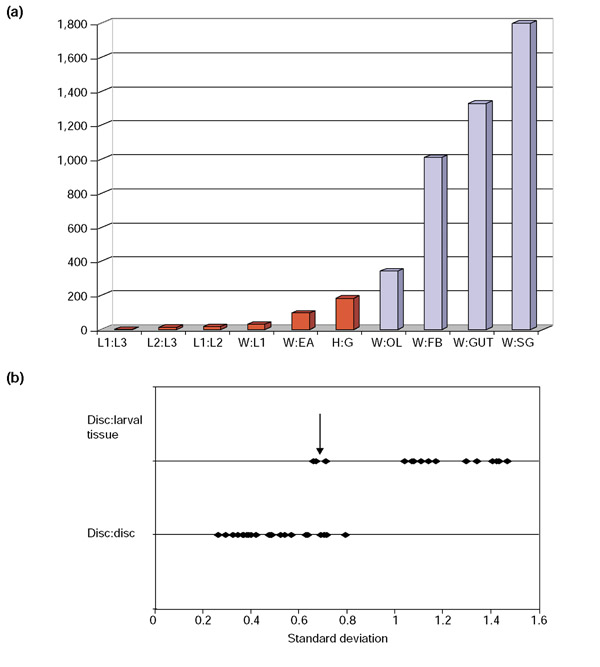
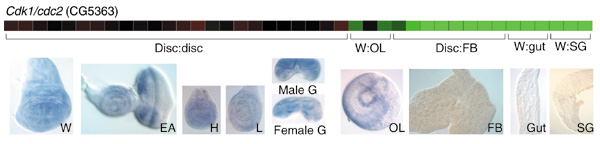
Results: Linear amplification protocols were used to generate hybridization probes for microarray analysis from poly(A)+ RNA from single imaginal discs containing between 10,000 and 60,000 cells. Probe reproducibility and degree of representation were tested using microarrays with approximately 6,000 different cDNAs. Hybridizations with probes that had been prepared separately from the same starting RNA pool had a correlation coefficient of 0.97. Expression-profile comparisons of the left and right wing imaginal discs from the same larva correlated with a coefficient of 0.99, indicating a high degree of reproducibility of independent amplifications. Using this method, we identified genes with preferential expression in the different imaginal discs using pairwise comparisons of discs and larval organs. Whereas disc-to-disc comparisons revealed only moderate differences, profiles differed substantially between imaginal discs and larval tissues, such as larval endodermal midgut and mesodermal fat body.

Conclusions: The combination of linear RNA amplification and DNA microarray hybridization allowed us to determine the expression profiles of individual imaginal discs and larval tissues and to identify genes expressed in tissue-specific patterns. These methods should be widely applicable to comparisons of expression profiles for tissues or parts of tissues that are available only in small amounts.


Figures

Figure 1
Figure 1
Quality and amount of total RNA preparations from imaginal discs. Total RNA was prepared separately from 2, 4 and 12 third-instar larval wing imaginal discs using the Mini RNA Isolation Kit (Zymo Research). The total amount of RNA, based on the absorbance at 260 nm (A260), was 462, 540 and 1,530 ng, respectively. The A260/A280 ratios of 2.08, 2.2 and 2.27 for the separate preparations is indicative of high-quality RNA preparations. The amount of total RNA per disc was calculated to be 230, 140 and 130 ng, respectively. Assuming a poly(A)+ RNA content of 1-2%, this amount of total RNA roughly corresponds to 1-4 ng poly(A)+ RNA per wing disc (62,000 cells). The other discs are smaller and contain fewer cells. The equivalent of 1, 2 and 6 discs was separated on a denaturing agarose gel (lanes 1, 2 and 3, respectively). The two prominent bands represent the 18S and 28S ribosomal RNA populations (arrowheads). Poly(A)+ RNA is detected as a smear. No obvious small-molecular-weight products were observed. Lane M contains molecular-weight markers, with numbers indicating the approximate lengths in nucleotides.
Figure 2
Figure 2
Linear amplification is highly reproducible. (a) Denaturing gel electrophoresis shows the size distribution of aRNA obtained after two rounds of linear amplification of 1 ng poly(A)+ RNA. Lane 1, total RNA; lanes 2 and 3, products of independent amplifications; M, molecular-weight markers, with numbers indicating the approximate lengths in nucleotides. (b,c) Scatterplots of the Cy3 and Cy5 signal intensities from hybridizations of two probes derived from independent amplifications of embryonic or wing-disc RNA. Starting materials were (b) 1 ng embryonic poly(A)+ RNA and (c) left and right wing imaginal discs of one wandering third-instar larva. CC, correlation coefficient; SD, standard deviation. SDs were calculated on the normalized log2-transformed R/G ratios.
Figure 3
Figure 3
Pairwise comparisons of prothoracic, mesothoracic and metathoracic leg discs (leg1, leg2 and leg3, respectively). Cluster analysis was carried out on the dataset with the requirement to show induction >1.74 (0.8 of the log2-transformed R/G ratio). In the color representation of the cluster results in this and the subsequent figures, the columns represent the different experiments and the rows indicate the genes. Seventeen genes were found to be differentially expressed between the first (ten genes, green cluster) and second leg discs (seven genes, red cluster) in three independently repeated experiments (numbers 91, 77 and 142). The comparison of first and third leg discs (two experiments, numbers 92 and 94) produced two genes in the leg1 cluster (green). Two experiments (numbers 106 and 81) revealed 12 genes that are differentially expressed between leg2 disc (three genes, green cluster) and leg3 disc (nine genes, red cluster). Note the expression of Antp in the second leg disc in the leg1-to-leg2 and leg2-to-leg3 comparisons, with more than threefold induction in both cases (see text). The columns indicate the subclusters with consistent induction in one channel, the gene identification numbers (ID), the average fold induction of the two or three comparisons (Fold), the gene name and function as published on Flybase [44]. The color code is indicated below with the numbers representing the fold induction.
Figure 4
Figure 4
A small number of genes are preferentially induced in the prothoracic leg disc. Two comparisons of the prothoracic leg disc (L1) to the wing disc (W) (numbers 83 and 93) are shown. The cluster analysis for these comparisons revealed 23 and 8 induced genes in the L1 (red) and W (green) subclusters, respectively. Note the expression of apterous in the wing disc cluster (see text).
Figure 5
Figure 5
Genes preferentially expressed in wing and eye-antennal discs. Amplified RNA from single discs of five individual larvae was used to carry out direct comparisons between a wing imaginal disc and an eye-antenna imaginal disc of the same larva (experiments 51, 88, 146, 155, 156, 157, 173 and 175). Whenever samples from one larva were used for more than one experiment, different left to right combinations of the individual discs were made. In two experiments, combinations of discs from two larvae (experiment 74) or pools of five larvae (ten wing and ten eye-antenna discs, experiment 98) were used. Cluster analysis was performed on the dataset with the requirement to show induction >1.74 (0.8 of the log2-transformed R/G ratio) in at least five experiments. One hundred and forty genes grouped into different subclusters. After removal of double hits or genes with inconsistent induction, 97 genes remained. Twenty-four genes were induced in the wing imaginal disc (red) and 73 genes in the eye-antennal disc (green). Black indicates lack of induction. Fold induction was calculated as an average induction in all experiments (column 3). The name, description and molecular or biological function is indicated as in Flybase [44] (columns 4 and 5). Some genes with known expression in the respective tissue are included in the clusters, such as apterous, engrailed and glass (see text). Of this set, 22 genes are uncharacterized and do not code for known protein domains. Note the high induction of CG9335 (16 fold) and CG11849 (6.9 fold) in the eye-antennal cluster. Genes marked in red were chosen for in situ experiments (see Figure 6).
Figure 6
Figure 6
Expression patterns of genes in the wing and eye-antennal clusters. In situ hybridizations of genes from (a-d) the wing and (f-i) eye-antennal disc clusters show the disc-specific patterns of expression. Confirming the mircoarray data, the signal intensities are higher in the wing discs in (a-d) (red frame) and the eye-antennal discs in (f-i) (green frame). Note the refined expression pattern in the wing disc for CG10962 in (c). In two cases, CG10962 (c) and CG9335 (g), signal could only be detected in the predicted disc. The arrowhead in (g) indicates the morphogenetic furrow. The number indicates the average fold induction in the 11 experiments. Arrestin2 (d) and CG11798 (f) were included in the clusters because their relative induction was >1.74 in more than five experiments. (e) CG6680 and (j) LD11162 failed the threshold criteria for the cluster depicted in Figure 4, but were part of a larger cluster with lower threshold settings. For both genes, the in situ patterns confirm the predicted expression. Discs are oriented anterior to the left, and dorsal uppermost.
Figure 7
Figure 7
Imaginal discs share a similar expression profile but differ from differentiated larval tissues. (a) Comparison between first and third leg discs. An enlargement of a representative block out of 32 blocks on the microarray is shown. It produced mostly yellow spots on the superimposed red (Cy5 labeling) and green (Cy3 labeling) images, indicative of a high degree of similarity in the respective expression profiles. (b) In a comparison of wing disc and fat body, the same block contained mostly red and green spots, indicating a high degree of divergence. (c,d) Scatterplots of Cy3 and Cy5 intensities in comparisons (c) between leg discs and (d) between wing disc and larval fat body. In the leg comparison the spots are in close proximity to the bisector (CC 0.93, SD 0.38) with only a small number of genes induced in either the leg1 or leg3 disc. In contrast, spots are spread widely to both sides of the bisector for the wing-to-fat body comparison (CC 0.37, SD 1.17), indicating a large number of differentially expressed genes. The data points are color coded such that spots that are induced >1.74 fold in the Cy5 channel are colored red and those induced >1.74 in the Cy3 channel in green. Ratios within a threshold of 1.74 are represented in black.
Figure 8
Figure 8
The mRNA populations in larval and imaginal tissues are distinct. (a) Graphical representation of the number of spots with intensity differences >1.74 when imaginal and larval tissues were compared. The numbers of spots are derived from cluster analysis of the repeated experiments. All disc-to-disc comparisons are represented by red bars, whereas the disc-to-nondisc comparisons are shown in blue. EA, eye-antennal; FB, fat body; G, genital; GUT, anterior part of the midgut; H, haltere; L1, leg 1; L2, leg 2; L3, leg 3, OL, optic lobe/brain; SG, salivary gland; W, wing. (b) A plot of the level of divergence as measured by the SD of the log2-transformed R/G ratios for all genes in 42 experiments (leaving out the wing-to-wing experiment). Of these, 25 experiments were comparisons of one imaginal disc to another (see text and Table 1) and the remaining 17 compared imaginal discs to larval tissue, that is, salivary gland, midgut, fat body and optic lobe/brain hemisphere. The disc-to-disc comparisons were placed on the lower line, whereas disc-to-nondisc comparisons are represented on the top line. All disc-to-disc experiments grouped to the left as a result of SD <1, indicating similarity of the expression profiles among the various imaginal discs. Disc-to-nondisc comparisons group to the right, with SD >1. A group of three experiments of disc-to-nondisc comparisons reveals low SDs in the range of disc-to-disc comparisons. These are the wing disc-to-optic lobe/brain hemisphere comparisons (arrow).
Figure 9
Figure 9
Cyclin-dependent kinase 1 (Cdk1/cdc2) is expressed in imaginal but not in larval tissues. The cluster analysis for Cdk1 is shown for 41 pairwise comparisons with each box representing one experiment. All the disc-to-disc comparisons (see text) group to the left and display ratios of the intensities close to 1, as indicated by the dark shades of red and green (color coding as in Figure 3). The in situ hybridization to the various imaginal discs confirmed that Cdk1 is expressed in all discs. Cluster analysis of the comparisons of discs (labeled in green) and larval tissues (red) showed a strong induction in imaginal discs (represented by the intense green staining). This finding is confirmed by previous descriptions that Cdk1 is downregulated in endoreplicated tissues and by the lack of signal after in situ hybridization (FB, GUT and SG). The wing disc (W) to brain/optic lobe (OL) comparisons revealed less induction of Cdk1 in the wing disc as indicated by the darker shades of green. This is in good agreement with in situ hybridization data that showed some expression, particularly in the proliferation zones of the optic lobe, but no signal in most parts of the brain. Abbreviations as in Figure 8.

References

    1. Struhl G. A homoeotic mutation transforming leg to antenna in Drosophila. Nature. 1981;292:635–638. - PubMed
    1. Moses K, Ellis MC, Rubin GM. The glass gene encodes a zinc-finger protein required by Drosophila photoreceptor cells. Nature. 1989;340:531–536. - PubMed
    1. Adams MD, Celniker SE, Holt RA, Evans CA, Gocayne JD, Amanatides PG, Scherer SE, Li PW, Hoskins RA, Galle RF, et al. The genome sequence of Drosophila melanogaster. Science. 2000;287:2185–2195. doi: 10.1126/science.287.5461.2185. - DOI - PubMed
    1. Andrews J, Bouffard GG, Cheadle C, Lu J, Becker KG, Oliver B. Gene discovery using computational and microarray analysis of transcription in the Drosophila melanogaster testis. Genome Res. 2000;10:2030–2043. - PMC - PubMed
    1. Brown V, Jin P, Ceman S, Darnell JC, O'Donnell WT, Tenenbaum SA, Jin X, Feng Y, Wilkinson KD, Keene JD, et al. Microarray identification of FMRP-associated brain mRNAs and altered mRNA translational profiles in fragile X syndrome. Cell. 2001;107:477–487. - PubMed

Publication types