

doi: 10.1186/gb-2002-3-8-software0003.
Epub 2002 Jul 15.
BioArray Software Environment (BASE): a platform for comprehensive management and analysis of microarray data
Affiliations
- PMID: 12186655
- PMCID: PMC139402
- DOI: 10.1186/gb-2002-3-8-software0003
Item in Clipboard
BioArray Software Environment (BASE): a platform for comprehensive management and analysis of microarray data
Genome Biol.
.
Abstract
The microarray technique requires the organization and analysis of vast amounts of data. These data include information about the samples hybridized, the hybridization images and their extracted data matrices, and information about the physical array, the features and reporter molecules. We present a web-based customizable bioinformatics solution called BioArray Software Environment (BASE) for the management and analysis of all areas of microarray experimentation. All software necessary to run a local server is freely available.
Figures
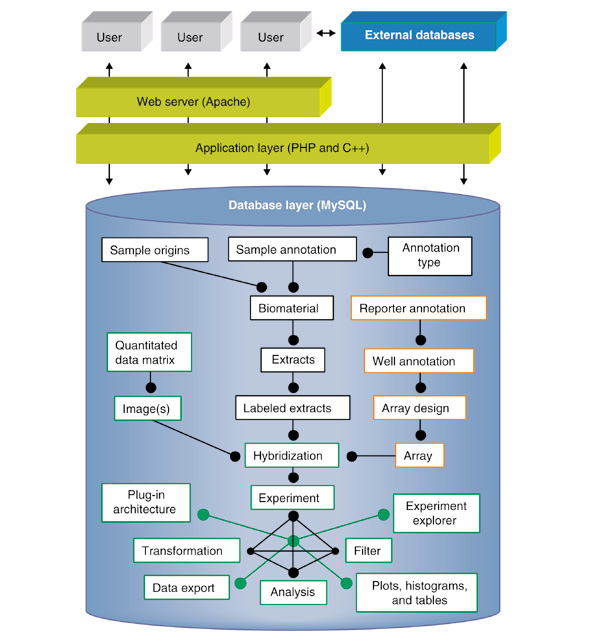
Simplified schematic overview of software structure. Arrows represent the flow of information. Closed circle connectors represent logical relationships between database classes. Database classes outlined by black boxes relate to biomaterials; array production LIMS items are highlighted by orange boxes; and data-analysis features are within green boxes. A detailed database schema is available from our website [34] and with this paper (see Downloading files).
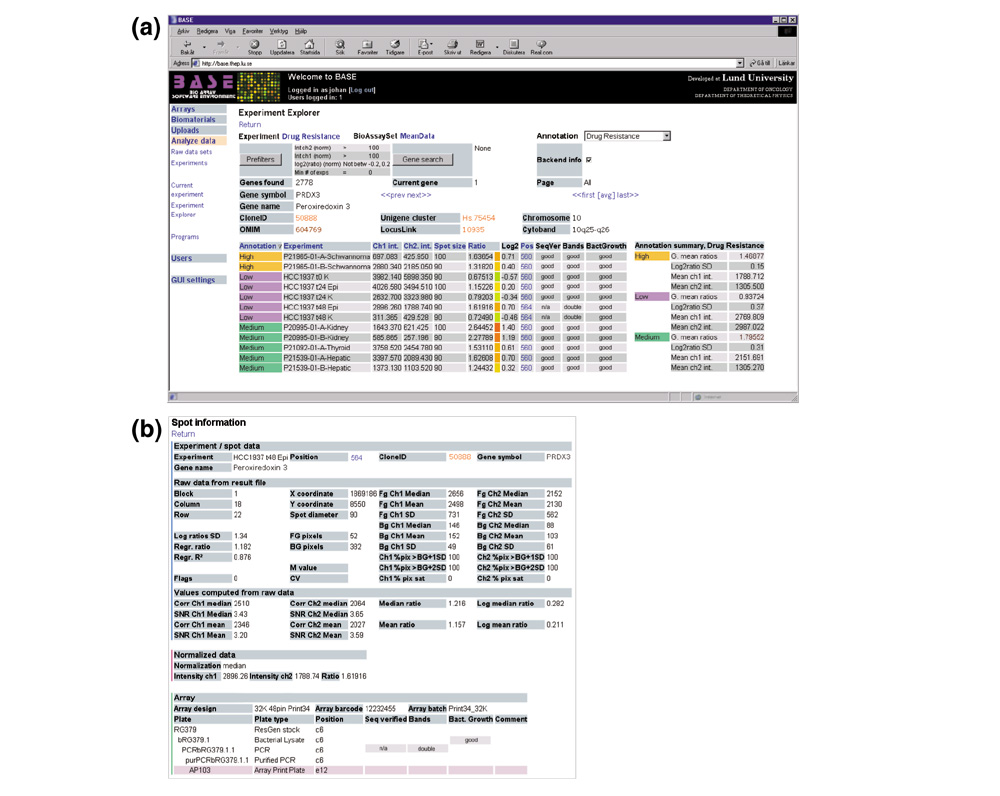
Browsing data with Experiment Explorer. Within BASE, the (a) Experiment Explorer displays data across all hybridizations in an experiment and relates it to the biological sample annotations, and optionally to the back-end array production LIMS. Reporter information is hyperlinked to external databases such as those at NCBI [20]. By clicking on a reporter position, the (b) Reporter Information page displays all raw and transformed data for the reporter as well as its production history from the array LIMS.
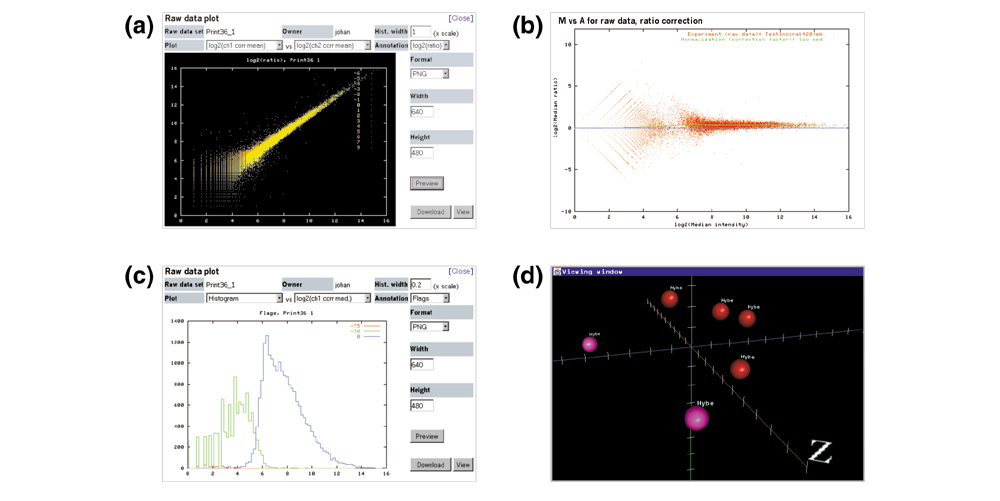
Example data visualization tools within BASE. Images can be resized and exported in several formats. (a) Interactive scatterplot displaying the log2 (ch1 background corrected mean intensity) versus log2 (ch2 corrected mean intensity) pseudocolored according to log2 (ratio). (b) M-A plot [35] of raw data displaying the intensity-dependent LOWESS [26] fitted normalization curve in green. (c) Interactive histogram of log2 (ch1 corrected median intensity) viewed in relation to spot flag annotations from image analysis software. (d) 3D Data Viewer displaying a rotatable and scalable MDS [28] result, in which samples (shown here as spheres) can be visualized in relation to their biomaterial annotations by changing their shape, color, and texture, or by adding floating text.
References
-
- Schena M, Shalon D, Davis RW, Brown PO. Quantitative monitoring of gene expression patterns with a complementary DNA microarray. Science. 1995;270:467–470. - PubMed
Publication types
MeSH terms
LinkOut - more resources
Full Text Sources
Other Literature Sources
