. 2002 Aug 19;196(4):417-30.
doi: 10.1084/jem.20020018.

Accumulation of immature Langerhans cells in human lymph nodes draining chronically inflamed skin

Affiliations

Accumulation of immature Langerhans cells in human lymph nodes draining chronically inflamed skin

F Geissmann et al. J Exp Med. .

Abstract

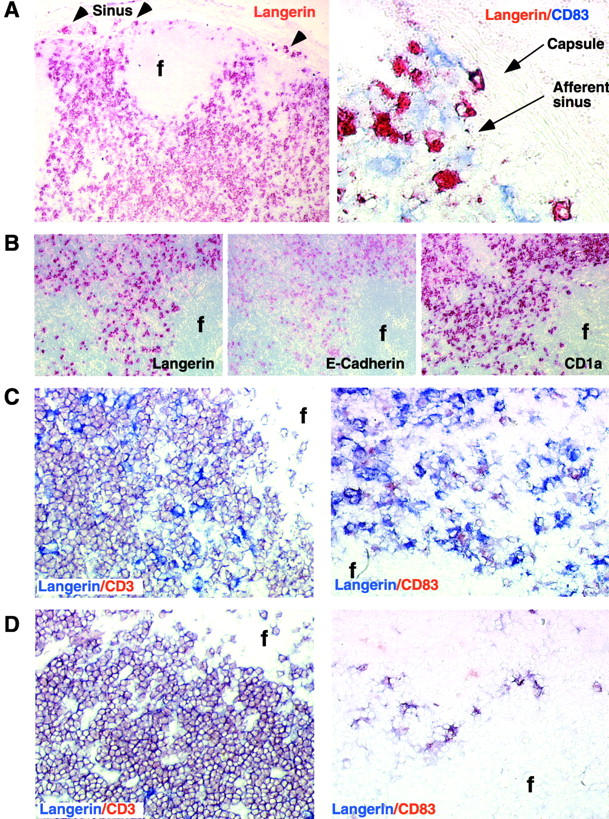
The coordinated migration and maturation of dendritic cells (DCs) such as intraepithelial Langerhans cells (LCs) is considered critical for T cell priming in response to inflammation in the periphery. However, little is known about the role of inflammatory mediators for LC maturation and recruitment to lymph nodes in vivo. Here we show in human dermatopathic lymphadenitis (DL), which features an expanded population of LCs in one draining lymph node associated with inflammatory lesions in its tributary skin area, that the Langerin/CD207(+) LCs constitute a predominant population of immature DCs, which express CD1a, and CD68, but not CD83, CD86, and DC-lysosomal-associated membrane protein (LAMP)/CD208. Using LC-type cells generated in vitro in the presence of transforming growth factor (TGF)-beta1, we further found that tumor necrosis factor (TNF)-alpha, as a prototype proinflammatory factor, and a variety of inflammatory stimuli and bacterial products, increase Langerin expression and Langerin dependent Birbeck granules formation in cell which nevertheless lack costimulatory molecules, DC-LAMP/CD208 and potent T cell stimulatory activity but express CCR7 and respond to the lymph node homing chemokines CCL19 and CCL21. This indicates that LC migration and maturation can be independently regulated events. We suggest that during DL, inflammatory stimuli in the skin increase the migration of LCs to the lymph node but without associated maturation. Immature LCs might regulate immune responses during chronic inflammation.


Figures

Figure 1.
Figure 1.
High numbers of LCs are recruited in afferent sinuses and T cell areas of inflammatory-skin draining LNs. LNs cryostat section (5 μm thick) from patients with DL were stained the indicated antibodies, representative sections are shown. (A, left) Langerin staining (in red, original magnification: ×100); (right) Langerin staining (in red) and anti-CD83 (in blue), original magnification: × 400. Arrowheads indicate the peripheral sinus. (B) Left and middle, Langerin, and E-cadherin staining (in red) on serial sections. Right CD1a staining, original magnification: ×100. “f” denotes B cell follicle. (C) Double immuno-staining of DL sections using anti-Langerin (revealed in blue with alkaline phosphatase) and anti-CD83 (left), or anti-CD3 (right) (revealed with peroxidase in brownish). (D) Similar staining on sections from reactive LN draining normal skin.
Figure 2.
Figure 2.
LN Langerin+ LCs express CD1α and CD68 but not CD83 DC–LAMP and CD86. (A) LNs cryostat section from patients with DL were stained with anti-CD83 antibody revealed with Cy5 (blue), FITC-anti-Langerin (green), and PE-anti CD68 (red) and analyzed by confocal microscopy. Representative sections are shown. Original magnification: ×400; (B) triple immunostaining on DL section using FITC-conjugated Langerin (green), anti-DC–LAMP antibody revealed with Cy5 (blue), and PE-anti CD68 (red) and analyzed by confocal microscopy. Magnification: ×100. (C) Double immunostaining on DL section using FITC anti-CD1a (green) and anti-Langerin revealed with Cy3 (red), and FITC-anti-Langerin (green), and PE-anti CD86 (red) and analyzed by confocal microscopy. Representative sections are shown. Original magnification: ×100.
Figure 3.
Figure 3.
In vitro differentiation of LC-type cells. (A) TNF-α upregulates membrane Langerin expression but not MHC class I, class II, and CD86. Cells were cultured for 5–6 d in the presence of the indicated cyto-kines as indicated in Materials and Methods. 10 ng/ml IL-4 was added at day 0 only. Cells were analyzed by flow cytometry for membrane expression of HLA-ABC, HLA-DR, Langerin, and CD1a and CD86. Dot plots are gated on viable cells. (B) CD40L but not TNF-α induces internalization of Langerin, upregulation of membrane HLA-DR and acquisition of a Mature dendritic shape. Cells cultured as in A are permeabilized and analyzed by confocal microscopy for expression of Langerin (top panel) and DR (bottom panel). Left panels represent cells cultured for 5–6 d in GM-CSF, IL-4 (added at day 0 only), and TGF-β1, middle panels represent cells cultured for 5–6 d in GM-CSF, IL-4 (added at day 0 only), TGF-β1, and TNF-α (10 ng/ml for the last 40 h of culture). The right panels represent cells cultured for 5–6 d in GM-CSF, IL-4 (added at day 0 only), TGF-β1, with CD40L transfected fibroblasts (for the last 40h of culture). Incubation with control fibroblasts (LcCD32) as described in Materials and Methods does not results in the activation of cells (unpublished data). Original magnification: × 400. (C) TNF-α treated LC-type cells express CD68 while CD40L treated LC-type cells express DC-LAMP. Cells cultured and processed as in B were analyzed for expression of Langerin, DC-LAMP and CD68 by three-color confocal microscopy. Left panels represent cells cultured for 5–6 d in GM-CSF, IL-4 (added at day 0 only), TGF-β1 and TNF-α (10 ng/ml for the last 40 h of culture). Right panels represent cells cultured for 5–6 d in GM-CSF, IL-4 (added at day 0 only), TGF-β1, with CD40L transfected fibroblasts (for the last 40 h of culture). Incubation with control fibroblasts (LcCD32) as described in Materials and Methods does not result in the activation of DCs (unpublished data and reference 26).
Figure 3.
Figure 3.
In vitro differentiation of LC-type cells. (A) TNF-α upregulates membrane Langerin expression but not MHC class I, class II, and CD86. Cells were cultured for 5–6 d in the presence of the indicated cyto-kines as indicated in Materials and Methods. 10 ng/ml IL-4 was added at day 0 only. Cells were analyzed by flow cytometry for membrane expression of HLA-ABC, HLA-DR, Langerin, and CD1a and CD86. Dot plots are gated on viable cells. (B) CD40L but not TNF-α induces internalization of Langerin, upregulation of membrane HLA-DR and acquisition of a Mature dendritic shape. Cells cultured as in A are permeabilized and analyzed by confocal microscopy for expression of Langerin (top panel) and DR (bottom panel). Left panels represent cells cultured for 5–6 d in GM-CSF, IL-4 (added at day 0 only), and TGF-β1, middle panels represent cells cultured for 5–6 d in GM-CSF, IL-4 (added at day 0 only), TGF-β1, and TNF-α (10 ng/ml for the last 40 h of culture). The right panels represent cells cultured for 5–6 d in GM-CSF, IL-4 (added at day 0 only), TGF-β1, with CD40L transfected fibroblasts (for the last 40h of culture). Incubation with control fibroblasts (LcCD32) as described in Materials and Methods does not results in the activation of cells (unpublished data). Original magnification: × 400. (C) TNF-α treated LC-type cells express CD68 while CD40L treated LC-type cells express DC-LAMP. Cells cultured and processed as in B were analyzed for expression of Langerin, DC-LAMP and CD68 by three-color confocal microscopy. Left panels represent cells cultured for 5–6 d in GM-CSF, IL-4 (added at day 0 only), TGF-β1 and TNF-α (10 ng/ml for the last 40 h of culture). Right panels represent cells cultured for 5–6 d in GM-CSF, IL-4 (added at day 0 only), TGF-β1, with CD40L transfected fibroblasts (for the last 40 h of culture). Incubation with control fibroblasts (LcCD32) as described in Materials and Methods does not result in the activation of DCs (unpublished data and reference 26).
Figure 4.
Figure 4.
Cross-linking of Langerin induces the formation of BGs in TNF-α treated LC-type cells. (–3) LC type-cells were cultured in the presence of GM-CSF, IL-4 (added at day 0 only), TGF-β1 and TNF-α (added at 10 ng/ml for the last 40 h of culture). Inset (1 and 3) show magnification of BGs. Bar = 100 nm on panels 1 and 3 and 1 p.m. on panel 2. (–7) Cells were cultured as for panels 1–3, and Langerin was cross-linked with mouse anti-Langerin Ab and gold-labeled goat anti–mouse Ig for various times. Panel 4 shows the formation of large numbers of gold labeled BGs and coated pits after a very short time (<1 min). Bar = 100 nm. Panels 5–7 show BGs and coated pits at higher magnification. In the absence of TGF-β1 however, TNF-α did not induce the expression of Langerin, nor the formation of BGs (unpublished data). Bar = 100 nm.
Figure 5.
Figure 5.
LC-type DCs cultured with TNF-α express CCR7 and migrate toward CCR7 ligands but are not functionally mature. (A) Autologous antigen presentation. LC-type cells (left) and DCi (right) unstimulated (open circles), or treated with TNF-α (closed circles) or CD40-activated LCs (closed triangles) were pulsed with TT. T cell proliferation was measured as indicated in Materials and Methods. Results are expressed as mean of triplicates in a representative experiment. SD were <20%. (B) Both SLC and ELC trigger migration of TNF-α and E. coli treated, but not control unstimulated LC-type cells. Day 6, LCs were treated for 48 h with TNF-α (10 ng/ml) or with heat-inactivated E. coli (50:1 ratio, right). Then, samples were recovered and cells were tested for their capacity to migrate in response to ELC (100 ng/ml) and to SLC (100 ng/ml). Migration assays were performed in Boyden microchambers. (Left) Results are expressed as number of migrating LCs per two low power fields (original magnification: ×20). (Right) Results are expressed as migration index compared with medium alone (without chemo-kine). Results are representative of more than three independent experiments. (C) CCR7 expression. Day 6, LC-type and DC-type cells were treated for 48 h with 10 ng/ml TNF-α. Cells were washed and stained with PE-conjugated anti-Langerin, FITC-anti-DR and anti-CCR7 or with isotype-matched controls antibodies and analyzed by flow cytometry. In the left panel, the dot-plot represent langerin and HLA-DR expression of LC-type cells treated with TNF-α. On the center and right panels histograms represent CCR7 expression on gated-cell populations (R1:Langerin1 DRlo; R2: Langerin-, DRhi). Thick lines represent the labeling obtained with CCR7 antibody and thin lines represent labeling with the isotype-matched control. Results are representative of two independent experiments.
Figure 5.
Figure 5.
LC-type DCs cultured with TNF-α express CCR7 and migrate toward CCR7 ligands but are not functionally mature. (A) Autologous antigen presentation. LC-type cells (left) and DCi (right) unstimulated (open circles), or treated with TNF-α (closed circles) or CD40-activated LCs (closed triangles) were pulsed with TT. T cell proliferation was measured as indicated in Materials and Methods. Results are expressed as mean of triplicates in a representative experiment. SD were <20%. (B) Both SLC and ELC trigger migration of TNF-α and E. coli treated, but not control unstimulated LC-type cells. Day 6, LCs were treated for 48 h with TNF-α (10 ng/ml) or with heat-inactivated E. coli (50:1 ratio, right). Then, samples were recovered and cells were tested for their capacity to migrate in response to ELC (100 ng/ml) and to SLC (100 ng/ml). Migration assays were performed in Boyden microchambers. (Left) Results are expressed as number of migrating LCs per two low power fields (original magnification: ×20). (Right) Results are expressed as migration index compared with medium alone (without chemo-kine). Results are representative of more than three independent experiments. (C) CCR7 expression. Day 6, LC-type and DC-type cells were treated for 48 h with 10 ng/ml TNF-α. Cells were washed and stained with PE-conjugated anti-Langerin, FITC-anti-DR and anti-CCR7 or with isotype-matched controls antibodies and analyzed by flow cytometry. In the left panel, the dot-plot represent langerin and HLA-DR expression of LC-type cells treated with TNF-α. On the center and right panels histograms represent CCR7 expression on gated-cell populations (R1:Langerin1 DRlo; R2: Langerin-, DRhi). Thick lines represent the labeling obtained with CCR7 antibody and thin lines represent labeling with the isotype-matched control. Results are representative of two independent experiments.
Figure 6.
Figure 6.
LPS and bacteria induce the maturation of DCi but not LC-type cells. Interstitial-type and LC-type DC were cultured for 5–6 d as indicated in Materials and Methods and incubated with either LPS, heat-inactivated E. coli, or BCG-GFP. (A and B) Coculture with LPS induces the maturation of interstitial type, but not LC-type DCs. LC-type (A) and (B) DCi treated with LPS were fixed, permeabilized, stained with FITC-conjugated anti–HLA-DR antibody and anti-Langerin antibody revealed with anti–mouse Cy3 (in red), and analyzed by confocal microscopy. Original magnification: ×400. (C–E) Coculture with heat inactivated E. coli does not induce the maturation of LC-type DC. LC-type DCs were cultured for 40 h in the presence of Texas-red conjugated heat-inactivated E. coli at a 50/1 ratio (C-E) or LcCD40L (F) and then collected, washed, fixed, permeabilized and stained with either FITC-conjugated anti-Langerin antibody (C and D) or FITC-conjugated anti–HLA-DR antibody and anti-Langerin antibody revealed with anti–mouse Cy5 (in blue) (E and F), and analyzed by confocal microscopy. Coculture of DCi induced their maturation (unpublished data). Panel G LC-type DC were cultured for 36 h in the presence of BCG-GFP and then collected, washed, fixed, permeabilized, stained with PE-conjugated anti-HLA-DR antibody and anti-Langerin antibody revealed with anti mouse Cy5 (in blue), and analyzed by confocal microscopy. Arrow indicates a Langerin DRhi DC and arrowheads Langerin+ DRlo DCs. Coculture of DCi with BCG-GFP induced their maturation (unpublished data). Bar = 10 μm, unless otherwise indicated.

Comment in

References

    1. Banchereau, J., and R.M. Steinman. 1998. Dendritic cells and the control of immunity. Nature. 392:245–252. - PubMed
    1. Sallusto, F., and A. Lanzavecchia. 1999. Mobilizing dendritic cells for tolerance, priming, and chronic inflammation. J. Exp. Med. 189:611–614. - PMC - PubMed
    1. Pierre, P., S.J. Turley, E. Gatti, M. Hull, J. Meltzer, A. Mirza, K. Inaba, R.M. Steinman, and I. Mellman. 1997. Developmental regulation of MHC class II transport in mouse dendritic cells. Nature. 388:787–792. - PubMed
    1. Cella, M., A. Engering, V. Pinet, J. Pieters, and A. Lanzavecchia. 1997. Inflammatory stimuli induce accumulation of MHC class II complexes on dendritic cells. Nature. 388:782–787. - PubMed
    1. Schuler, G., and R.M. Steinman. 1985. Murine epidermal Langerhans cells mature into potent immunostimulatory dendritic cells in vitro. J. Exp. Med. 161:526–546. - PMC - PubMed

Publication types

MeSH terms