. 2002 Aug 19;196(4):447-57.
doi: 10.1084/jem.20020052.

Inhibition of allogeneic T cell proliferation by indoleamine 2,3-dioxygenase-expressing dendritic cells: mediation of suppression by tryptophan metabolites

Affiliations

Inhibition of allogeneic T cell proliferation by indoleamine 2,3-dioxygenase-expressing dendritic cells: mediation of suppression by tryptophan metabolites

Peter Terness et al. J Exp Med. .

Abstract

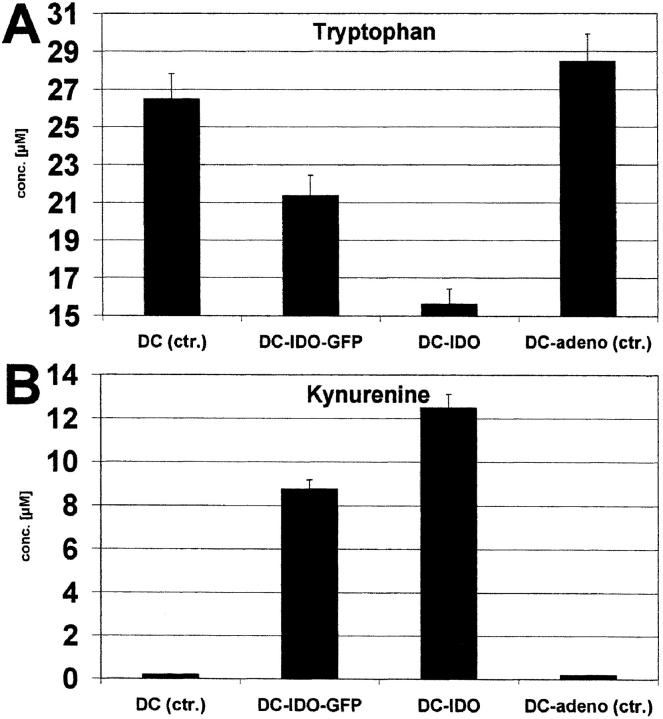
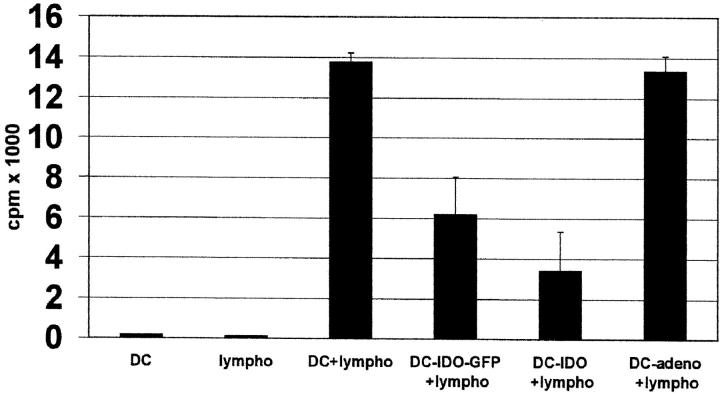
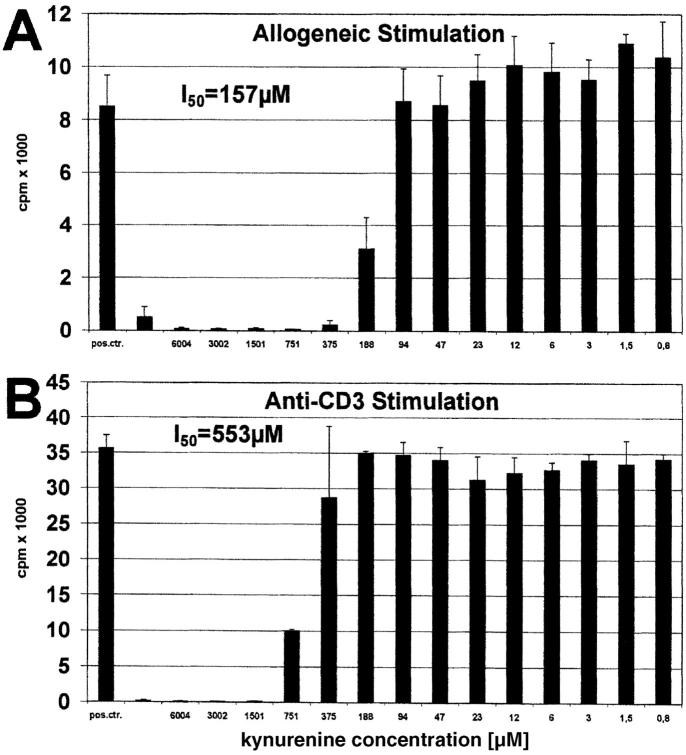
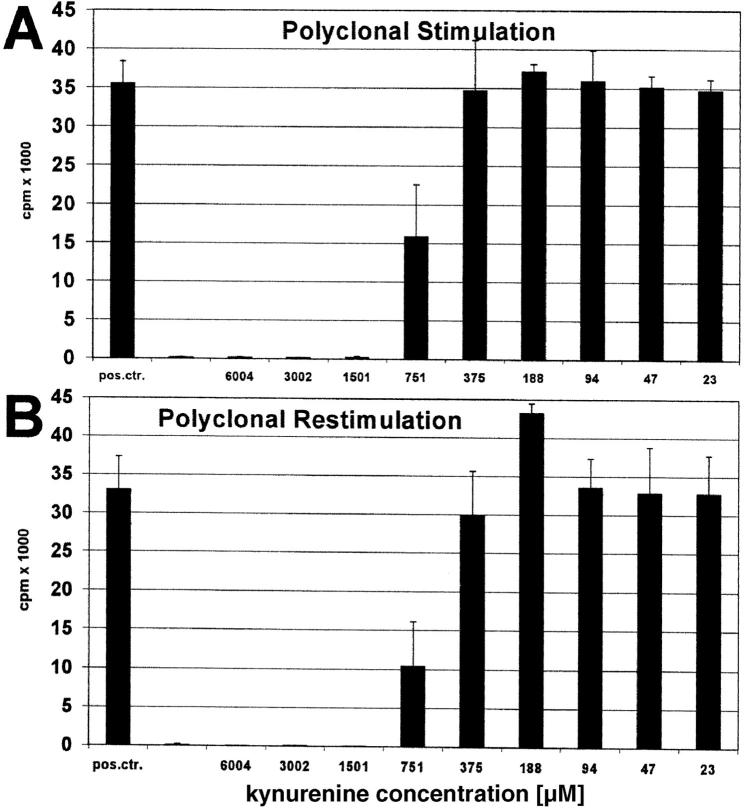
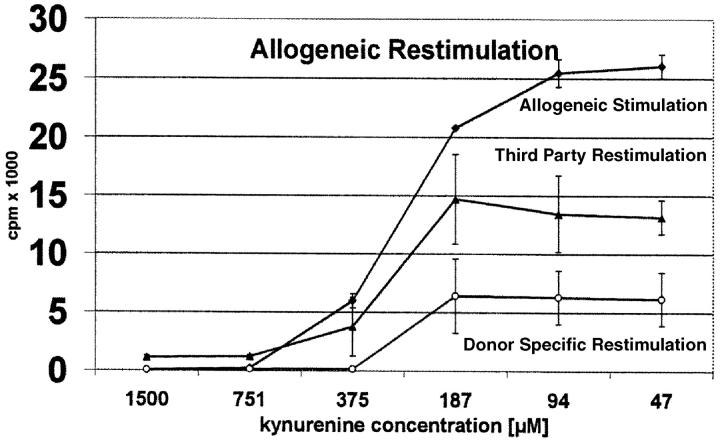
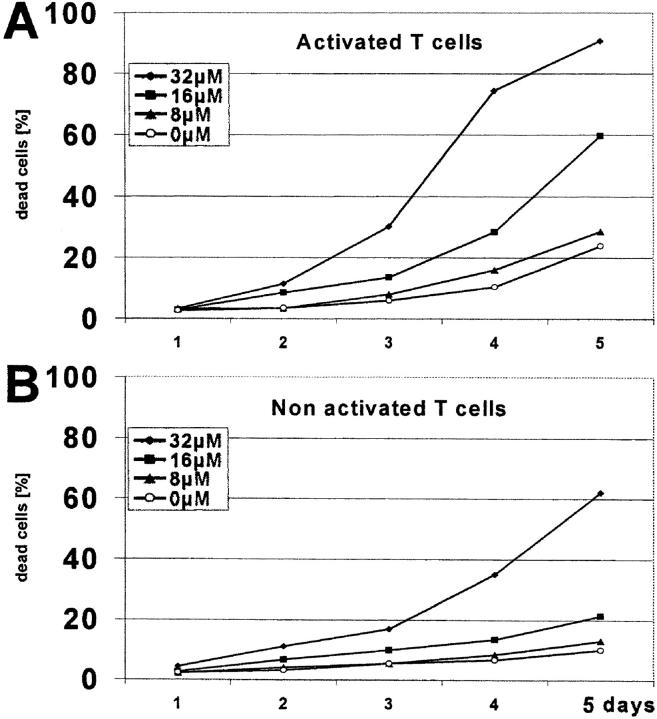
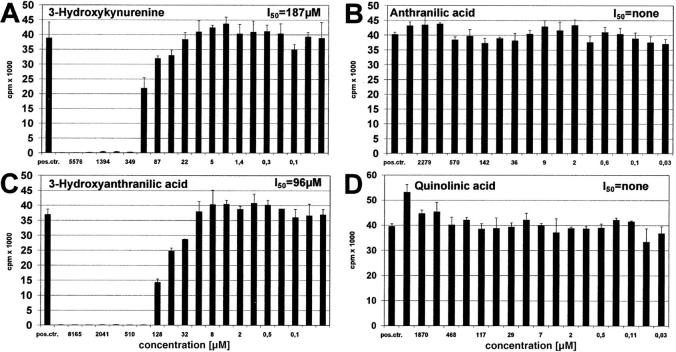
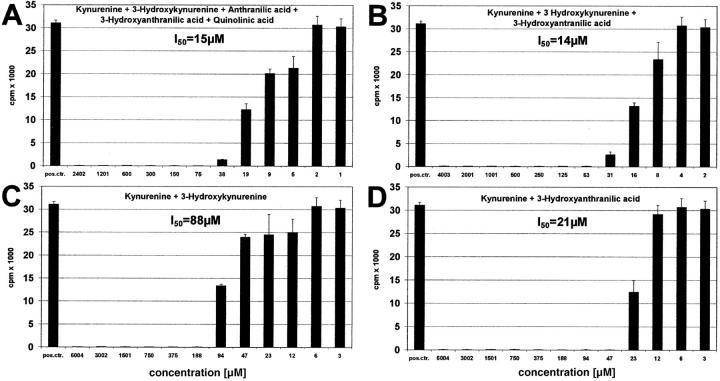
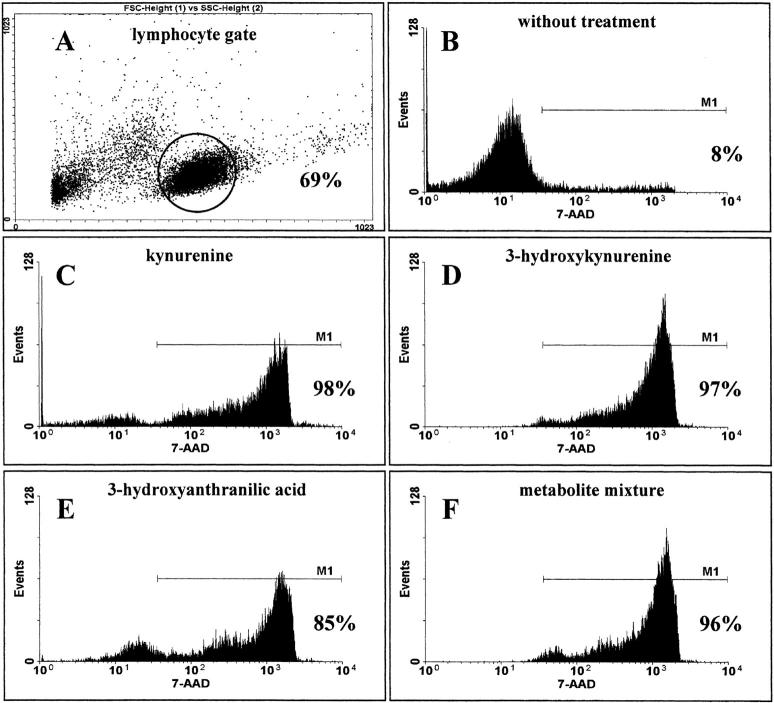
Indoleamine 2,3-dioxygenase (IDO), an enzyme involved in the catabolism of tryptophan, is expressed in certain cells and tissues, particularly in antigen-presenting cells of lymphoid organs and in the placenta. It was shown that IDO prevents rejection of the fetus during pregnancy, probably by inhibiting alloreactive T cells, and it was suggested that IDO-expression in antigen-presenting cells may control autoreactive immune responses. Degradation of tryptophan, an essential amino acid required for cell proliferation, was reported to be the mechanism of IDO-induced T cell suppression. Because we wanted to study the action of IDO-expressing dendritic cells (DCs) on allogeneic T cells, the human IDO gene was inserted into an adenoviral vector and expressed in DCs. Transgenic DCs decreased the concentration of tryptophan, increased the concentration of kynurenine, the main tryptophan metabolite, and suppressed allogeneic T cell proliferation in vitro. Kynurenine, 3-hydroxykynurenine, and 3-hydroxyanthranilic acid, but no other IDO-induced tryptophan metabolites, suppressed the T cell response, the suppressive effects being additive. T cells, once stopped in their proliferation, could not be restimulated. Inhibition of proliferation was likely due to T cell death because suppressive tryptophan catabolites exerted a cytotoxic action on CD3(+) cells. This action preferentially affected activated T cells and increased gradually with exposure time. In addition to T cells, B and natural killer (NK) cells were also killed, whereas DCs were not affected. Our findings shed light on suppressive mechanisms mediated by DCs and provide an explanation for important biological processes in which IDO activity apparently is increased, such as protection of the fetus from rejection during pregnancy and possibly T cell death in HIV-infected patients.


Figures

Figure 1.
Figure 1.
Transcription of IDO-gene in eukaryotic cells infected with recombinant IDO-adenoviruses. mRNA was extracted from human embryonic retinoblast cells infected with IDO-adeno-GFP, IDO-adeno, or with replication-defective adenoviruses (neg. ctr.-a) and reverse transcribed into cDNA. PCR with IDO-specific primers was performed and the products analyzed by agarose gel electrophoresis. Positive control consisted of material extracted from recombinant IDO-adenoviruses and neg. ctr.-b of water instead of template. Lane 1: DNA molecular weight marker; lane 2: pos. ctr., 3, neg. ctr.-b; lane: 4, IDO-adeno-GFP; lane 5: IDO-adeno; lane 6: neg. ctr.-a; lane 7: DNA molecular weight marker. Lanes 4 and 5 show the relevant IDO-specific bands.
Figure 2.
Figure 2.
Tryptophan and kynurenine concentration in cultures of IDO-expressing DCs. Native DCs (control), DCs infected with IDO-adeno-GFP, IDO-adeno, or native replication-defective adenoviruses (control) were cultured in RPMI 1640 plus 10% FCS. Tryptophan (A) and kynurenine (B) concentrations were determined and the values (μM/105 cells) are shown on the ordinate.
Figure 3.
Figure 3.
Reduction of allogeneic T cell stimulation by IDO-expressing DCs. Native DCs (pos. ctr.), DCs infected with IDO-adeno-GFP, IDO-adeno, or replication-defective adenoviruses (control) were coincubated with allogeneic peripheral blood lymphocytes for 6 d and cell proliferation measured by 3[H]thymidine incorporation (cpm) (ordinate). Negative controls consisted of DCs or lymphocytes only.
Figure 4.
Figure 4.
Effect of kynurenine on T cell proliferation induced by allogeneic DCs or anti-CD3 antibody. Peripheral lymphocytes were stimulated with (A) allogeneic DCs or (B) anti-CD3 mAb for 6 and 3 d, respectively. Various amounts of kynurenine (abscissa) were added to the cultures. Positive control was performed without kynurenine. T cell proliferation was determined by 3[H]thymidine incorporation (cpm) (ordinate).
Figure 5.
Figure 5.
Polyclonal restimulation of kynurenine-suppressed T cells. Peripheral lymphocytes were stimulated with (A) anti-CD3 mAb in the presence of various amounts of kynurenine (abscissa). Positive control consisted of T cell stimulation in the absence of kynurenine. After 2 d the cells were washed and (B) restimulated with Con-A for another 3 d. T cell proliferation was determined by 3[H]thymidine incorporation (cpm) (ordinate).
Figure 6.
Figure 6.
Allogeneic restimulation of T cells activated with allogeneic DCs. Peripheral blood lymphocytes were stimulated with allogeneic DCs in the presence of decreasing amounts of kynurenine (abscissa). After 5 d the cells were extensively washed and restimulated with DCs from the same or unrelated donors. T cell proliferation was measured by 3[H]thymidine incorporation (cpm) (ordinate) after primary and secondary stimulation. The curves show the degree of proliferation after the first stimulation (top curve) and upon restimulation with third-party (intermediate) or donor-specific DCs (bottom curve).
Figure 10.
Figure 10.
Time dependency of cytotoxicity and preferential killing of activated T cells. T cells were separated from PBMCs using magnetic beads and kept in culture (A) with anti-CD3 antibody or (B) without anti-CD3 antibody, in the presence of a mixture of tryptophan metabolites (kynurenine plus 3-hydroxykynurenine plus anthranilic acid plus 3-hydroxyanthranilic acid plus quinolinic acid) (concentrations: 0, 8, 16, 32 μM for each compound). The percentage of dead cells (ordinate) was measured every day (abscissa) by 7-AAD staining.
Figure 7.
Figure 7.
Effect of IDO-induced tryptophan metabolites on T cell proliferation. Peripheral lymphocytes were stimulated with anti-CD3 antibody for 3 d in the presence of various amounts (abscissa) of (A) 3-hydroxykynurenine, (B) anthranilic acid, (C) 3-hydroxyanthranilic acid, or (D) quinolinic acid. Positive control consisted of T cell stimulation in the absence of metabolites. T cell proliferation was determined by 3[H]thymidine incorporation (cpm) (ordinate).
Figure 8.
Figure 8.
Additive effect of tryptophan metabolites. Peripheral lymphocytes were stimulated with anti-CD3 antibody for 3 d and decreasing amounts of (A) kynurenine plus 3-hydroxykynurenine plus anthranilic acid plus 3-hydroxyanthranilic acid plus quinolinic acid, (B) kynurenine plus 3-hydroxykynurenine plus 3-hydroxyanthranilic acid, (C) kynurenine plus 3-hydroxykynurenine, (D) kynurenine plus 3-hydroxyanthranilic acid were added. All components of a mixture were added in equal amounts. The concentration of single substances is shown (abscissa).
Figure 9.
Figure 9.
Induction of cell death by tryptophan metabolites. Lymphocytes were stimulated with anti-CD3 in the presence or absence (control) of active metabolites (1,501 μM kynurenine, 349 μM 3-hydroxykynurenine, 510 μM 3-hydroxyanthranilic acid) or a metabolite mixture (kynurenine plus 3-hydroxykynurenine plus anthranilic acid plus 3-hydroxyanthranilic acid plus quinolinic acid)(64 μM of each compound). After 3 d the cells were washed, stained with anti-CD3-FITC antibody and 7-AAD. The percentages of dead (7-AAD-positive) T cells was determined in FACScan™. A shows the lymphocyte gate. B–F show the percentage of dead cells in the negative control and after treatment with kynurenine, 3-hydroxyanthranilic acid, 3-hydroxykynurenine, or metabolite mixture.
Figure 11.
Figure 11.
Sensitivity of T, B, NK cells and DCs to tryptophan metabolites. T, B, and NK cells were separated from PBMCs and DCs were generated as described previously. The cells were incubated with a metabolite mixture (kynurenine plus 3-hydroxykynurenine plus anthranilic acid plus 3-hydroxyanthranilic acid plus quinolinic acid) (concentrations: 0, 8, 16, 32 μM for each metabolite). The percentage of dead cells (ordinate) was measured by 7-AAD-staining every day (abscissa).

References

    1. Yoshida, R., T. Nukiwa, Y. Watanabe, M. Fujiwara, F. Hirata, and O. Hayashi. 1980. Regulation of indoleamine 2,3-dioxygenase activity in the small intestine and the epididymis of mice. Arch. Biochem. Biophys. 203:343–351. - PubMed
    1. Taylor, M.W., and G. Feng. 1991. Relationship between interferon-γ, indoleamine 2,3-dioxygenase, and tryptophan catabolism. FASEB J. 5:2516–2522. - PubMed
    1. Mellor, A.L., and D.H. Munn. 1999. Tryptophan catabolism and T-cell tolerance: immunosuppression by starvation? Immunol. Today. 20:469–473. - PubMed
    1. Yoshida, R., Y. Urade, M. Tokuda, and O. Hayashi. 1979. Induction of indoleamine 2,3 dioxygenase in mouse lung during virus infection. Proc. Natl. Acad. Sci. USA. 76:4084–4086. - PMC - PubMed
    1. Yoshida, R., and O. Hayashi. 1978. Induction of pulmonary indoleamine 2,3-dioxygenase by intraperitoneal injection of bacterial lipopolysaccharide. Proc. Natl. Acad. Sci. USA. 75:3998–4000. - PMC - PubMed

Publication types