. 2002 Aug 19;196(4):459-68.
doi: 10.1084/jem.20020121.

Tryptophan-derived catabolites are responsible for inhibition of T and natural killer cell proliferation induced by indoleamine 2,3-dioxygenase

Affiliations

Tryptophan-derived catabolites are responsible for inhibition of T and natural killer cell proliferation induced by indoleamine 2,3-dioxygenase

Guido Frumento et al. J Exp Med. .

Abstract

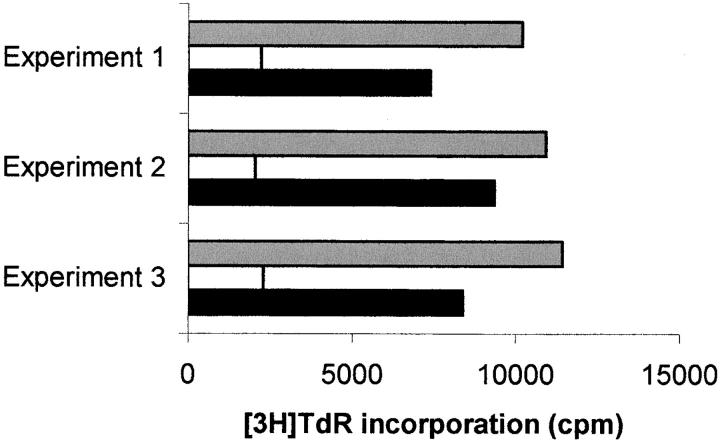
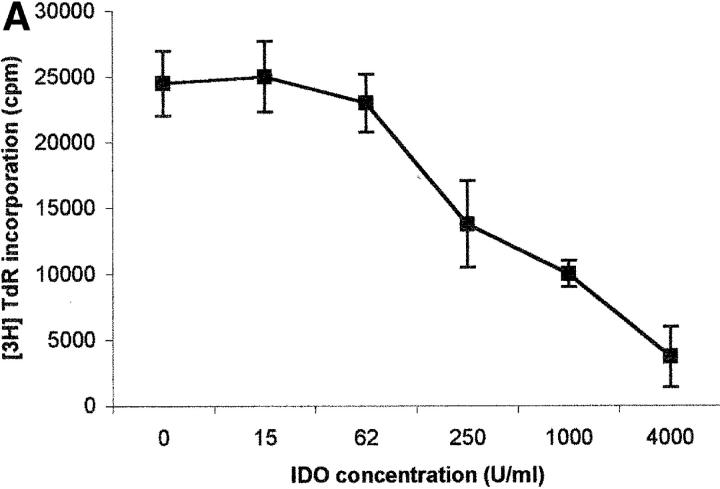
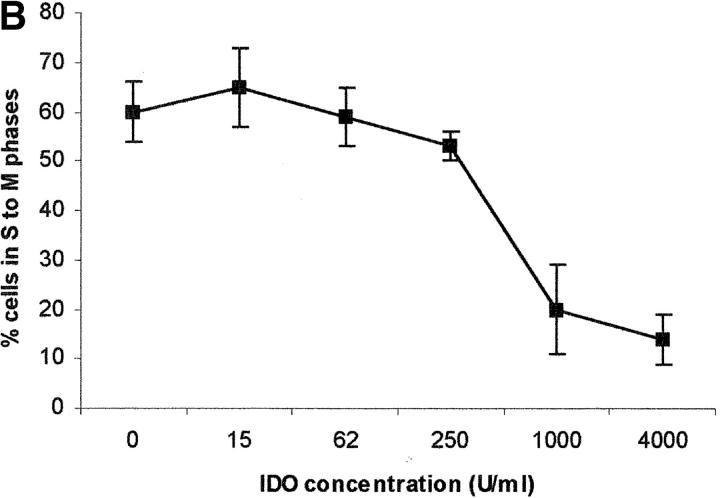
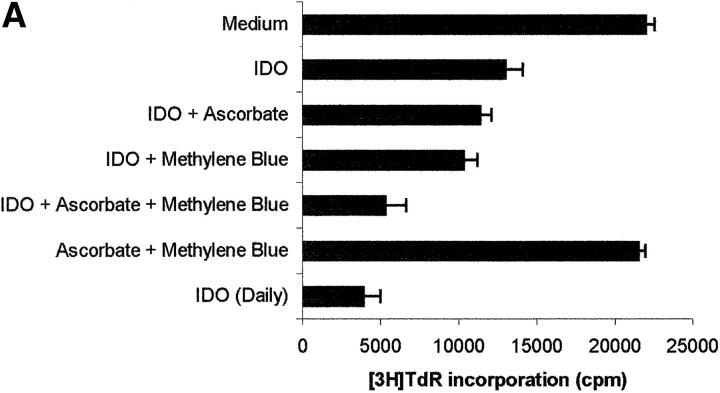
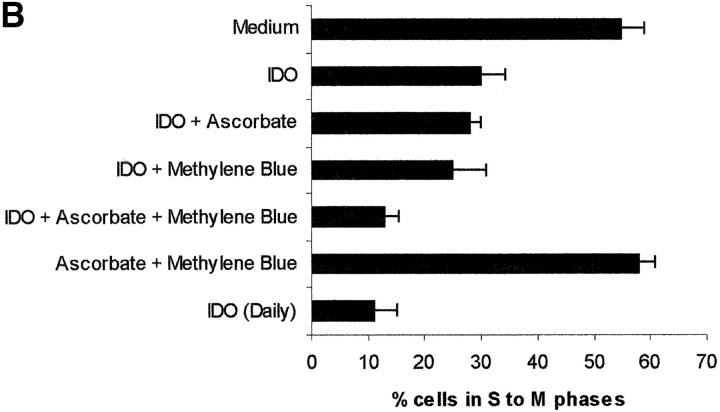
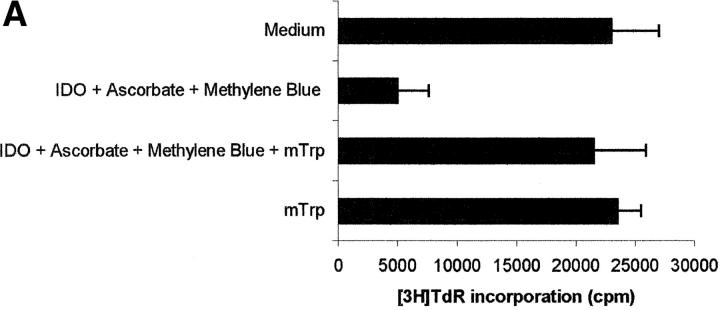
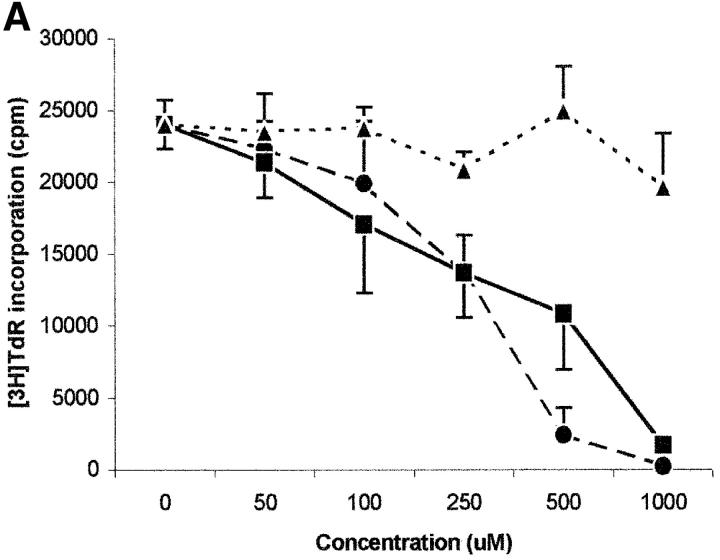
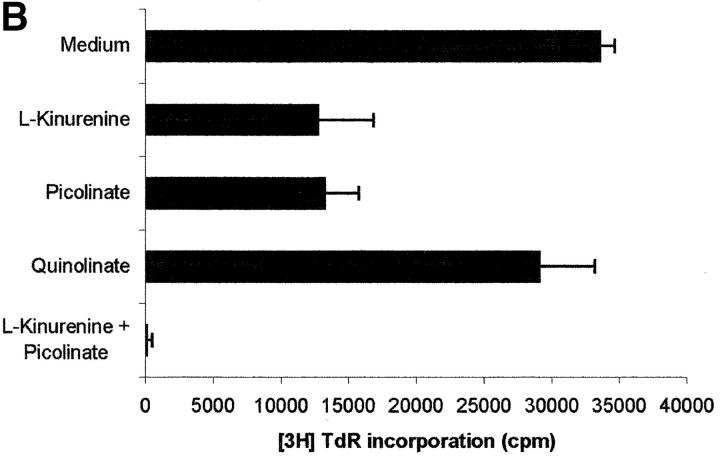
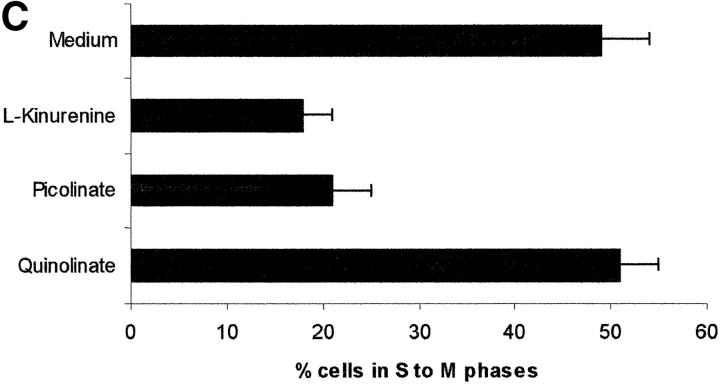
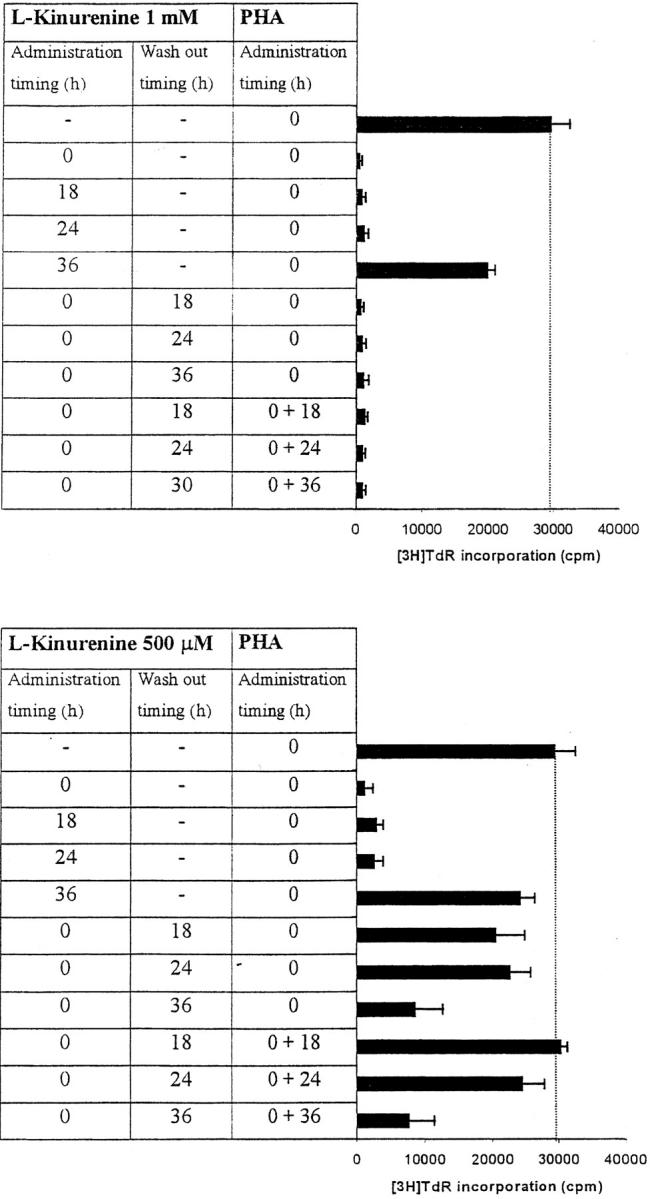
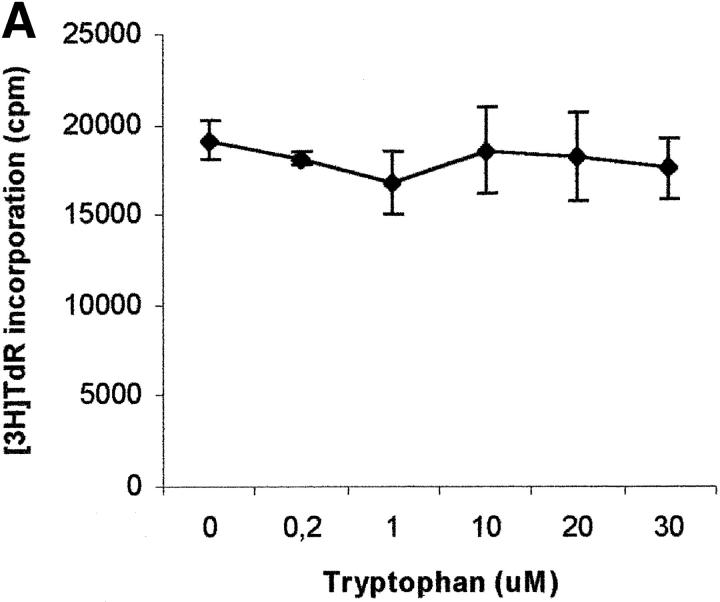
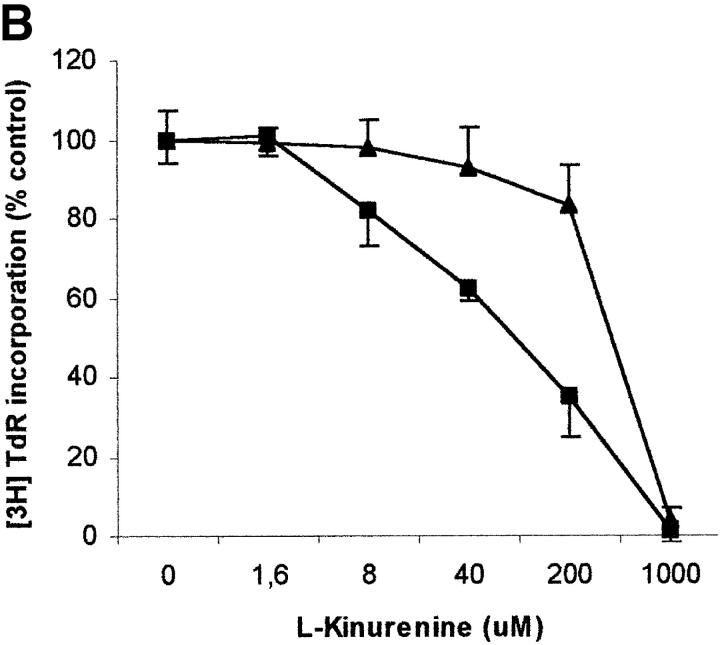
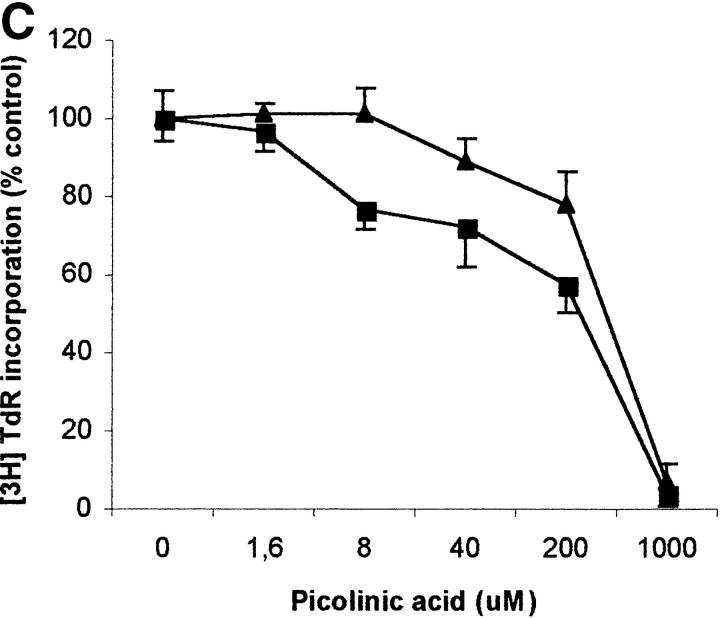
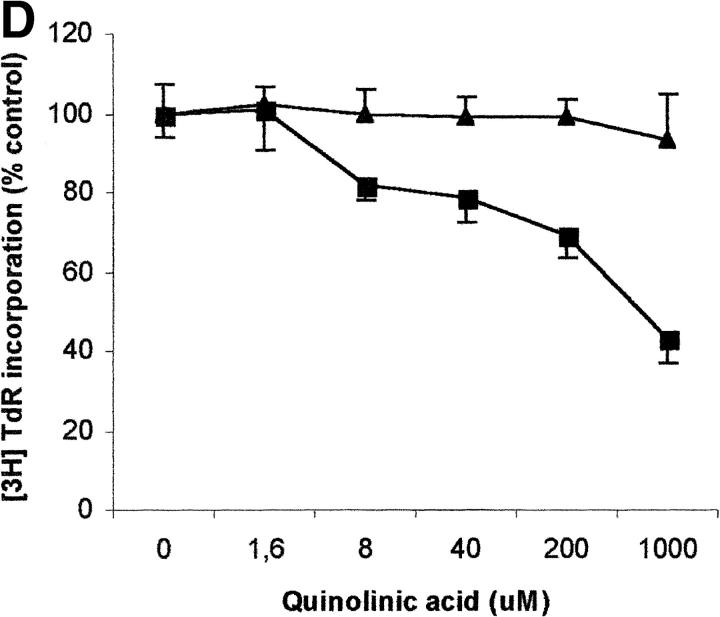
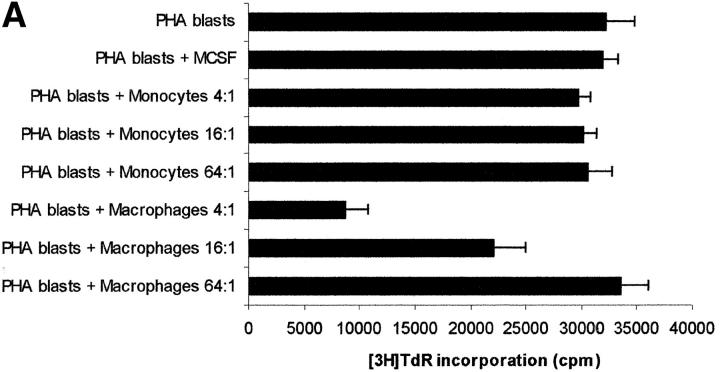
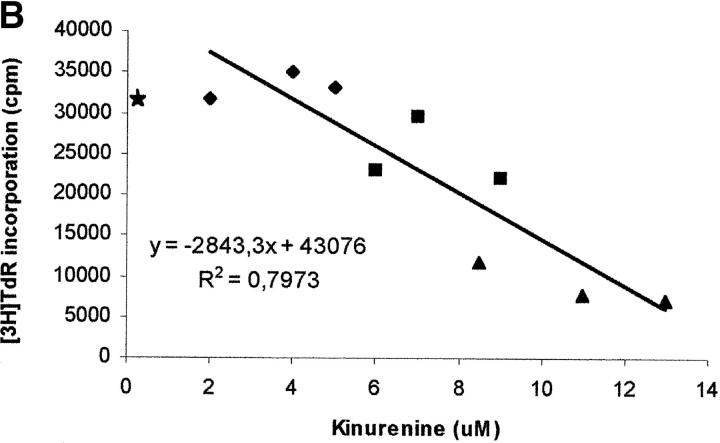
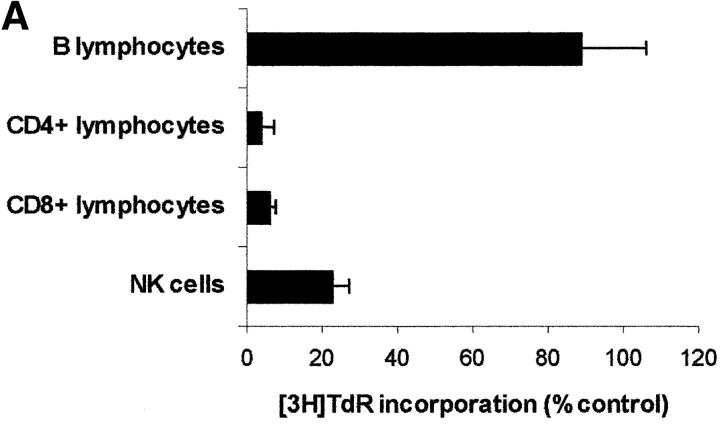
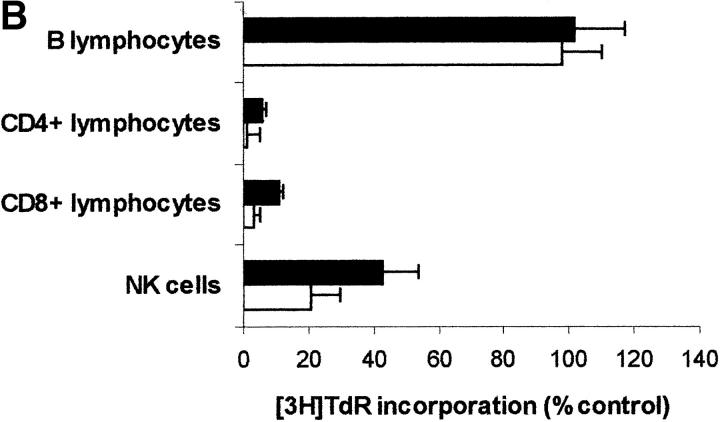
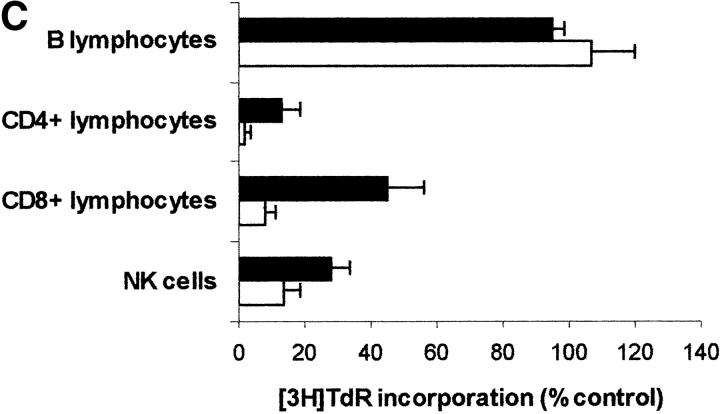
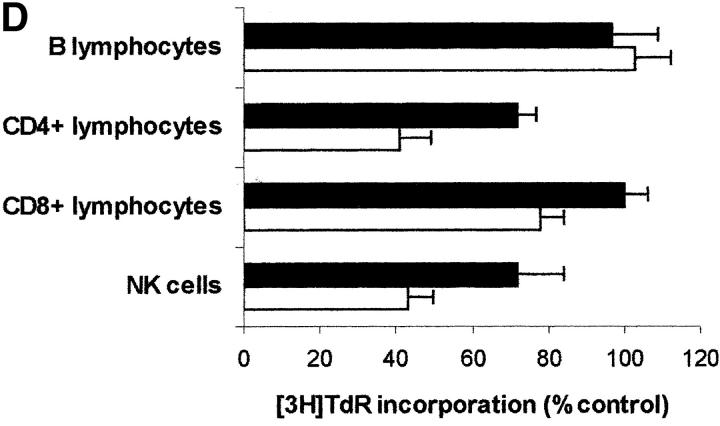
Macrophages exposed to macrophage colony-stimulating factor acquire the capacity to suppress T cell proliferation; this effect is associated with de novo expression of the tryptophan-catabolizing enzyme indoleamine 2,3-dioxygenase (IDO). We have purified IDO and tested its activity in in vitro models of T cell activation. IDO was able to inhibit proliferation of CD4(+) T lymphocytes, CD8(+) T lymphocytes, and natural killer (NK) cells; proliferation of B lymphocytes was not affected. The inhibitory role of tryptophan and of its catabolites was then tested. In the presence of tryptophan, only L-kynurenine and picolinic acid inhibit cell proliferation. In a tryptophan-free medium cell proliferation was not affected. In the absence of tryptophan inhibition induced by L-kynurenine and picolinic acid was observed at concentrations below the lowest concentration that was effective in the presence of tryptophan, and quinolinic acid acquired some inhibitory capacity. Inhibition of cell proliferation induced by the tryptophan catabolites resulting from IDO activity was selective, applying only to cells undergoing activation. Resting cells were not affected and could subsequently activate normally. We suggest that IDO exerts its effect on cell proliferation by (i) starting the cascade of biochemical reactions that produce the three catabolites and by (ii) enhancing their inhibitory potential by depriving the extracellular microenvironment of tryptophan.


Figures

Figure 9.
Figure 9.
Effect of l-kynurenine on responsiveness of activated and resting cells. MLRs were initially performed either in the presence (white columns and black columns) or in the absence (gray columns) of l-kynurenine. 5 d after cells were washed and cultures were then restimulated with either cells from the initial stimulator (white columns) or from a different donor (black columns). After 7 more days cell proliferation was evaluated by measuring 3[H]thymidine incorporation. Three experiments, using different responders and stimulators were performed. Each column indicates the mean from three wells.
Figure 1.
Figure 1.
Dose–response relationship to IDO for T cell proliferation. Increasing doses of IDO, together with 0.1 μM methylene blue and 200 μM l-ascorbic acid, were added at the beginning of the test to PHA-activated PBLs. Untreated cells were used as control. Cell culture was stopped at 96 h and proliferation was evaluated by measuring 3[H]thymidine incorporation (A) or by counting the cells in the cell cycle, as indicated in the Materials and Methods section (B). m ± 1 SD, n = 3.
Figure 1.
Figure 1.
Dose–response relationship to IDO for T cell proliferation. Increasing doses of IDO, together with 0.1 μM methylene blue and 200 μM l-ascorbic acid, were added at the beginning of the test to PHA-activated PBLs. Untreated cells were used as control. Cell culture was stopped at 96 h and proliferation was evaluated by measuring 3[H]thymidine incorporation (A) or by counting the cells in the cell cycle, as indicated in the Materials and Methods section (B). m ± 1 SD, n = 3.
Figure 2.
Figure 2.
Role of cofactors on IDO activity. PHA-activated PBLs were incubated with the indicated combinations of 4,000 U/ml IDO, 0.1 μM methylene blue, and 200 μM l-ascorbic acid. In a set of experiments 800 U IDO were added daily to the cell culture, in the absence of cofactors. Control is represented by cells incubated with medium alone. Cell culture was stopped after 96 h and proliferation was evaluated by measuring 3[H]thymidine incorporation (A) or by counting the cells in the cell cycle (B). m ± 1 SD, n = 3.
Figure 2.
Figure 2.
Role of cofactors on IDO activity. PHA-activated PBLs were incubated with the indicated combinations of 4,000 U/ml IDO, 0.1 μM methylene blue, and 200 μM l-ascorbic acid. In a set of experiments 800 U IDO were added daily to the cell culture, in the absence of cofactors. Control is represented by cells incubated with medium alone. Cell culture was stopped after 96 h and proliferation was evaluated by measuring 3[H]thymidine incorporation (A) or by counting the cells in the cell cycle (B). m ± 1 SD, n = 3.
Figure 3.
Figure 3.
Effect of the IDO competitive inhibitor 1-methyl-DL-tryptophan. PHA-activated PBLs were incubated with the indicated combinations of 4,000 U/ml IDO, 0.1 μM methylene blue, 200 μM l-ascorbic acid, and 1 mM 1-methyl-DL-tryptophan. Control is represented by cells incubated with medium alone. Cell culture was stopped after 96 h and proliferation was evaluated by measuring 3[H]thymidine incorporation (A) or by counting the cells in the cell cycle (B). m ± 1 SD, n = 3.
Figure 3.
Figure 3.
Effect of the IDO competitive inhibitor 1-methyl-DL-tryptophan. PHA-activated PBLs were incubated with the indicated combinations of 4,000 U/ml IDO, 0.1 μM methylene blue, 200 μM l-ascorbic acid, and 1 mM 1-methyl-DL-tryptophan. Control is represented by cells incubated with medium alone. Cell culture was stopped after 96 h and proliferation was evaluated by measuring 3[H]thymidine incorporation (A) or by counting the cells in the cell cycle (B). m ± 1 SD, n = 3.
Figure 4.
Figure 4.
Effect of tryptophan catabolites on T cell proliferation. (A) Increasing concentrations of l-kynurenine (▪––▪), picolinic acid (•- - -•), or quinolinic acid (▴…▴) were added to PHA-activated PBLs. Cell culture was stopped after 96 h and proliferation was evaluated by measuring 3[H]thymidine incorporation. (B) PHA-activated PBLs were incubated with the indicated combinations of 250 μM l-kynurenine, picolinic acid, or quinolinic acid. Control is represented by cells incubated with medium alone. Cell culture was stopped after 96 h and proliferation was evaluated by measuring 3[H]thymidine incorporation. (C) PHA-activated PBLs were incubated with 250 μM of l-kynurenine, picolinic acid, or quinolinic acid, respectively. Control is represented by untreated PHA-blasts. Cell culture was stopped after 96 h and the cells in the cell cycle were counted. m ± 1 SD, n = 3.
Figure 4.
Figure 4.
Effect of tryptophan catabolites on T cell proliferation. (A) Increasing concentrations of l-kynurenine (▪––▪), picolinic acid (•- - -•), or quinolinic acid (▴…▴) were added to PHA-activated PBLs. Cell culture was stopped after 96 h and proliferation was evaluated by measuring 3[H]thymidine incorporation. (B) PHA-activated PBLs were incubated with the indicated combinations of 250 μM l-kynurenine, picolinic acid, or quinolinic acid. Control is represented by cells incubated with medium alone. Cell culture was stopped after 96 h and proliferation was evaluated by measuring 3[H]thymidine incorporation. (C) PHA-activated PBLs were incubated with 250 μM of l-kynurenine, picolinic acid, or quinolinic acid, respectively. Control is represented by untreated PHA-blasts. Cell culture was stopped after 96 h and the cells in the cell cycle were counted. m ± 1 SD, n = 3.
Figure 5.
Figure 5.
Timing of l-kynurenine–dependent inhibition of T cell proliferation. l-kynurenine at 1 mM concentration (top) or at 500 μM (bottom) was added to PHA-activated PBLs at the beginning of the test, or 18, 24 or 36 h after PHA activation, timing of l-kynurenine administration being indicated in the left column. In a subset of experiments l-kynurenine, administered at the beginning of the test, was removed from the samples at the times indicated in the central column: samples were centrifuged, supernatant was discarded, and cells were resuspended in medium. In a further subset of experiments PHA was administered again to the cells immediately after l-kynurenine wash-out (right column). Control is represented by untreated PHA-activated PBLs. Cell culture was stopped after 96 h from PHA activation, and proliferation was evaluated by measuring 3[H]thymidine incorporation. The degree of proliferation is indicated by the bars in the right part of each panel. The dotted line shows thymidine incorporation of control. m ± 1 SD, n = 3.
Figure 6.
Figure 6.
Effect of tryptophan concentration on tryptophan catabolites-dependent inhibition of T cell proliferation. (A) Increasing concentrations of l-tryptophan were added to PBLs activated and cultured in a medium devoid of tryptophan. Cell culture was stopped after 96 h from PHA activation, and proliferation was evaluated by measuring 3[H]thymidine incorporation. (B–D) Increasing concentrations of l-kynurenine (B), picolinic acid (C), and quinolinic acid (D) were added to PBLs activated and cultured in tryptophan-free medium (▪——▪), or in the tryptophan-free medium supplemented with 26 μM l-tryptophan (▴——▴). Controls were represented by untreated PHA-activated PBLs grown in tryptophan-free medium and in the same medium supplemented with l-tryptophan, respectively. Cell culture was stopped after 96 h from PHA activation, and proliferation was evaluated by measuring 3[H]thymidine incorporation. To permit comparison, proliferation has been normalized to the control cultures (PHA-activated PBLs grown in tryptophan-free medium: 19,134 ± 1,109 cpm; PHA-activated PBLs grown in tryptophan-free medium supplemented with l-tryptophan: 20,021 ± 1,776 cpm). m ± 1 SD, n = 3.
Figure 6.
Figure 6.
Effect of tryptophan concentration on tryptophan catabolites-dependent inhibition of T cell proliferation. (A) Increasing concentrations of l-tryptophan were added to PBLs activated and cultured in a medium devoid of tryptophan. Cell culture was stopped after 96 h from PHA activation, and proliferation was evaluated by measuring 3[H]thymidine incorporation. (B–D) Increasing concentrations of l-kynurenine (B), picolinic acid (C), and quinolinic acid (D) were added to PBLs activated and cultured in tryptophan-free medium (▪——▪), or in the tryptophan-free medium supplemented with 26 μM l-tryptophan (▴——▴). Controls were represented by untreated PHA-activated PBLs grown in tryptophan-free medium and in the same medium supplemented with l-tryptophan, respectively. Cell culture was stopped after 96 h from PHA activation, and proliferation was evaluated by measuring 3[H]thymidine incorporation. To permit comparison, proliferation has been normalized to the control cultures (PHA-activated PBLs grown in tryptophan-free medium: 19,134 ± 1,109 cpm; PHA-activated PBLs grown in tryptophan-free medium supplemented with l-tryptophan: 20,021 ± 1,776 cpm). m ± 1 SD, n = 3.
Figure 7.
Figure 7.
Relationship between degree of proliferation and concentration of kynurenine in coculture supernatants. (A) PHA-activated PBLs (PHA blasts) were cultured alone, in the presence of monocytes at the ratios indicated, in the presence of MCSF-treated macrophages at the ratios indicated, or in the presence of the MCSF solution (200 U/ml) used with macrophages. Cell culture was stopped after 96 h from PHA activation, and proliferation was evaluated by measuring 3[H] thymidine incorporation. m ± 1CD, n = 3. (B) PHA-activated PBLs were cultured in the presence of MCSF-treated macrophages at ratios of 4:1 (♦), 16:1 (▴), 64:1(▪), each ratio being performed in triplicate. Supernatants were collected from cocultures 72 h after the addition of PBLs, and levels of kynurenine were measured, as described in Materials and Methods section. Cell culture was stopped after 24 more hours, and proliferation was evaluated by measuring 3[H]thymidine incorporation. The amount of kynurenine in each supernatant was related to the level of proliferation in the well. The regression line is indicated. Star indicates the mean of thymidine incorporation of three wells with PHA-activated PBLs alone.
Figure 7.
Figure 7.
Relationship between degree of proliferation and concentration of kynurenine in coculture supernatants. (A) PHA-activated PBLs (PHA blasts) were cultured alone, in the presence of monocytes at the ratios indicated, in the presence of MCSF-treated macrophages at the ratios indicated, or in the presence of the MCSF solution (200 U/ml) used with macrophages. Cell culture was stopped after 96 h from PHA activation, and proliferation was evaluated by measuring 3[H] thymidine incorporation. m ± 1CD, n = 3. (B) PHA-activated PBLs were cultured in the presence of MCSF-treated macrophages at ratios of 4:1 (♦), 16:1 (▴), 64:1(▪), each ratio being performed in triplicate. Supernatants were collected from cocultures 72 h after the addition of PBLs, and levels of kynurenine were measured, as described in Materials and Methods section. Cell culture was stopped after 24 more hours, and proliferation was evaluated by measuring 3[H]thymidine incorporation. The amount of kynurenine in each supernatant was related to the level of proliferation in the well. The regression line is indicated. Star indicates the mean of thymidine incorporation of three wells with PHA-activated PBLs alone.
Figure 8.
Figure 8.
Effect of IDO and tryptophan-derived catabolites on different PBL subpopulations. (A) The different cell subpopulations were activated as indicated in the Materials and Methods section, and cultured in the presence of 4,000 U/ml IDO, 0.1 μM methylene blue, and 200 μM l-ascorbic acid. Cell culture was stopped after 96 h from activation, and proliferation was evaluated by measuring 3[H]thymidine incorporation. For each subpopulation untreated activated cells were used as control. m ± 1 SD, n = 3. (B–D) The effect of 1 mM l-kynurenine (B), 1 mM picolinic acid (C), and 1 mM quinolinic acid (D) was tested on each PBL subpopulation. The different cell subpopulations were activated as indicated in the Materials and Methods section, and cultured either in tryptophan-free medium (white columns), or in tryptophan-free medium supplemented with 26 μM l-tryptophan (black columns). Cell culture was stopped after 96 h from activation, and proliferation was evaluated by measuring 3[H]thymidine incorporation. For each subpopulation untreated cells, activated and cultured in the same medium, were used as control. m ± 1 SD, n = 3.
Figure 8.
Figure 8.
Effect of IDO and tryptophan-derived catabolites on different PBL subpopulations. (A) The different cell subpopulations were activated as indicated in the Materials and Methods section, and cultured in the presence of 4,000 U/ml IDO, 0.1 μM methylene blue, and 200 μM l-ascorbic acid. Cell culture was stopped after 96 h from activation, and proliferation was evaluated by measuring 3[H]thymidine incorporation. For each subpopulation untreated activated cells were used as control. m ± 1 SD, n = 3. (B–D) The effect of 1 mM l-kynurenine (B), 1 mM picolinic acid (C), and 1 mM quinolinic acid (D) was tested on each PBL subpopulation. The different cell subpopulations were activated as indicated in the Materials and Methods section, and cultured either in tryptophan-free medium (white columns), or in tryptophan-free medium supplemented with 26 μM l-tryptophan (black columns). Cell culture was stopped after 96 h from activation, and proliferation was evaluated by measuring 3[H]thymidine incorporation. For each subpopulation untreated cells, activated and cultured in the same medium, were used as control. m ± 1 SD, n = 3.

References

    1. Taylor, M.W., and G. Feng. 1991. Relationship between interferon-γ, indoleamine 2,3-dioxygenase, and tryptophan catabolism. FASEB J. 5:2516–2522. - PubMed
    1. Widner, B., G. Weiss, and D. Fuchs. 2000. Tryptophan degradation to control T-cell responsiveness. Immunol. Today. 21:250. - PubMed
    1. Mellor, A.L., and D.H. Munn. 1999. Tryptophan catabolism and T-cell tolerance: immunosuppression by starvation? Immunol. Today. 20:469–473. - PubMed
    1. Munn, D.H., M. Zhou, J.T. Attwood, I. Bondarev, S.J. Conway, B. Marshall, C. Brown, and L.A. Mellor. 1998. Prevention of allogenic fetal rejection by tryptophan catabolism. Science. 281:1191–1193. - PubMed
    1. Mellor, A.L., J. Sivakumar, P. Chandler, K. Smith, H. Molina, D. Mao, and D.H. Mellor. 2001. Prevention of T cell-driven complement activation and inflammation by tryptophan catabolism during pregnancy. Nat. Immunol. 2:64–68. - PubMed

Publication types