. 2002 Aug 19;158(4):731-40.
doi: 10.1083/jcb.200202024. Epub 2002 Aug 19.

REN: a novel, developmentally regulated gene that promotes neural cell differentiation

Affiliations

REN: a novel, developmentally regulated gene that promotes neural cell differentiation

Rita Gallo et al. J Cell Biol. .

Abstract

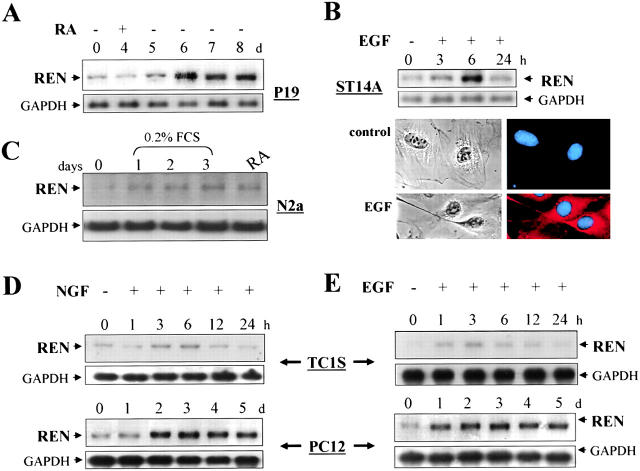
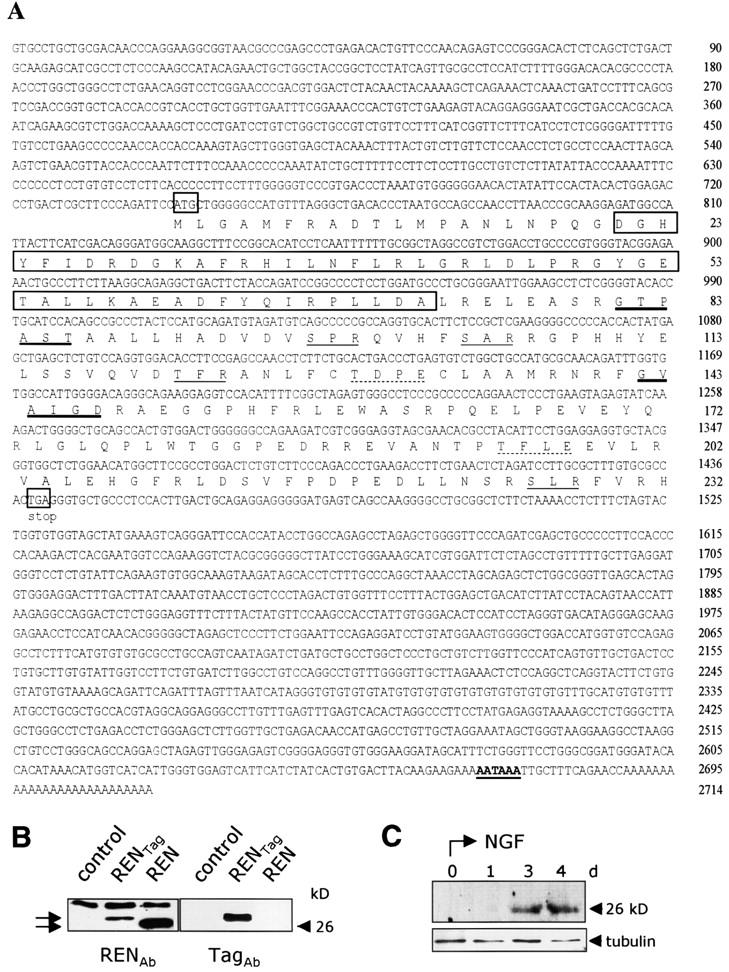
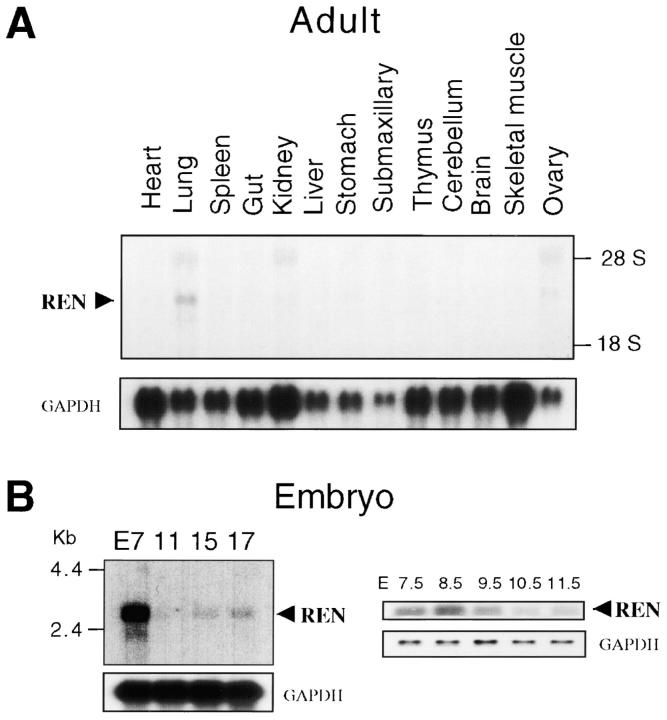
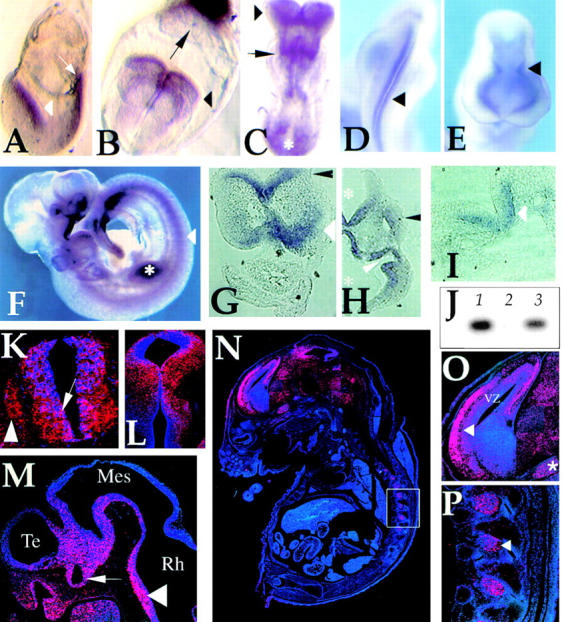
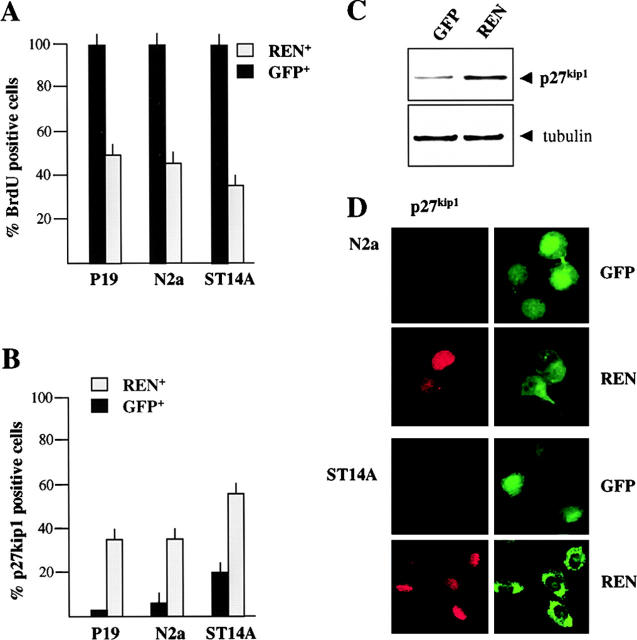
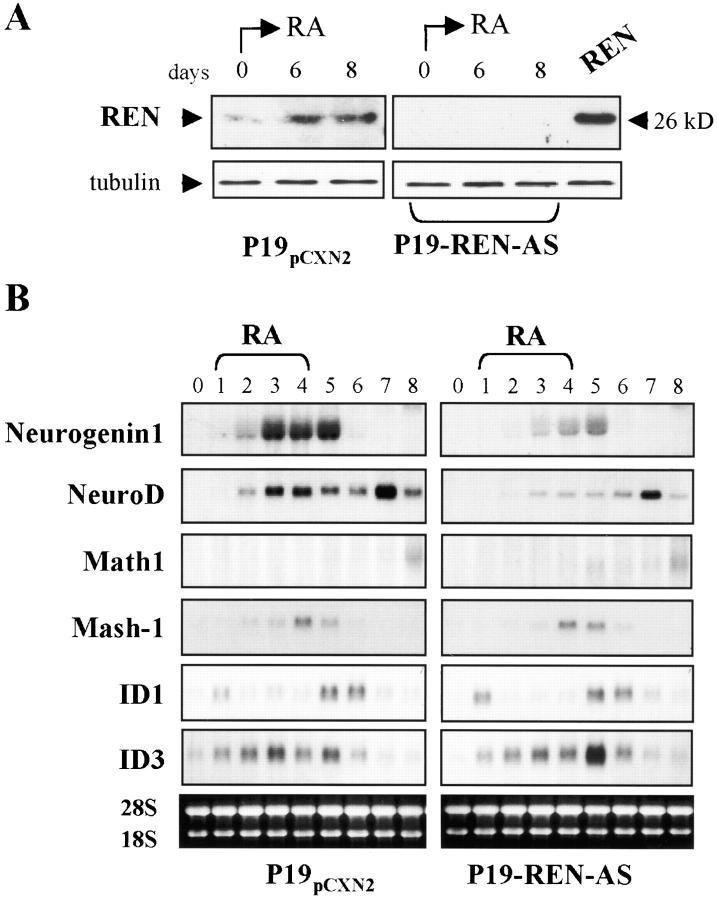
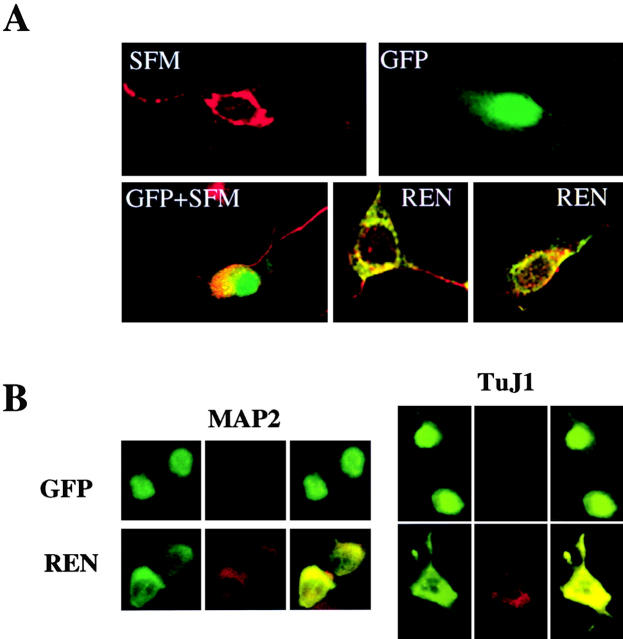
Expansion and fate choice of pluripotent stem cells along the neuroectodermal lineage is regulated by a number of signals, including EGF, retinoic acid, and NGF, which also control the proliferation and differentiation of central nervous system (CNS) and peripheral nervous system (PNS) neural progenitor cells. We report here the identification of a novel gene, REN, upregulated by neurogenic signals (retinoic acid, EGF, and NGF) in pluripotent embryonal stem (ES) cells and neural progenitor cell lines in association with neurotypic differentiation. Consistent with a role in neural promotion, REN overexpression induced neuronal differentiation as well as growth arrest and p27Kip1 expression in CNS and PNS neural progenitor cell lines, and its inhibition impaired retinoic acid induction of neurogenin-1 and NeuroD expression. REN expression is developmentally regulated, initially detected in the neural fold epithelium of the mouse embryo during gastrulation, and subsequently throughout the ventral neural tube, the outer layer of the ventricular encephalic neuroepithelium and in neural crest derivatives including dorsal root ganglia. We propose that REN represents a novel component of the neurogenic signaling cascade induced by retinoic acid, EGF, and NGF, and is both a marker and a regulator of neuronal differentiation.


Figures

Figure 1.
Figure 1.
REN is upregulated by multiple neural differentiation signals. Northern blot analysis of REN mRNA in P19 (A), ST14A (B), N2a (C), and TC1S and PC12 (D and E) cells. Hybridization with REN (top) and the ubiquitous GADPH (bottom) are indicated. P19 cells aggregates were treated with 1 μM RA for 4 d and, after plating, cultured in the absence of RA for further 4 d. ST14A cells were treated for 1–24 h with EGF (10 ng/ml) (B, top). (B, bottom) Phase contrast microscopy (left) and immunofluorescence coimmunostaining of cells with either anti-MAP2 antibody (red) or Hoechst (blue, right), 3 d after culturing in the absence (control) or in the presence of EGF treatment (EGF). N2a cells were cultured either in 0.2% FCS for 1–3 d or in the presence of 2% FCS plus 20 μM RA for 2 d (RA). TC-1S and PC12 cells were treated for 1–24 h or 1–5 d, respectively, with EGF (10 ng/ml, E) or with NGF (50 ng/ml, D).
Figure 2.
Figure 2.
Sequence and expressoin of REN cDNA and protein. (A) Nucleotide and predicted amino acid sequence of mouse REN cDNA. The first and last codons of the ORF are boxed and the putative polyadenylation signal is in bold-face type and underlined. Putative casein kinase 2 (dotted underline), protein kinase C (underline), and N-myristoylation (thick underline) sites and BTB/POZ motif (boxed) are shown. These sequence data are available from at EMBL/GenBank/DDBJ accession no. AF465352. (B) Western blot analysis of REN protein in cell lysates from COS7 mock-transfected cells (control), transiently transfected with pCXN2-REN-myc encoding myc epitope-tagged REN protein (RENTag) or with pCXN2-REN encoding wild- type REN (REN) (arrows). Immunoblotting was performed with either anti-REN (RENAb) polyclonal or anti-myc (TagAb) monoclonal antibodies. (C) Western blot analysis of REN protein in cell lysates from PC12 cells treated for the indicated times with NGF, revealed by anti-REN antibody. α-Tubulin staining is also shown, as a loading control.
Figure 3.
Figure 3.
REN mRNA levels in adult murine tissues and during embryo development. Northern blot analysis of RNA isolated from adult mouse tissues (A) or from E7 to E17 whole embryos (CLONTECH Laboratories, Inc.; B, left), hybridized with REN cDNA. RT-PCR analysis (B, right) of REN RNA isolated from embryos at E7.5–E11.5. RT-PCR analysis of coamplified GAPDH is also shown.
Figure 4.
Figure 4.
REN expression in mouse embryo tissues during development. Whole-mount in situ hybridization at E7.5 (A), E8 (B), E8.25 (C), E9 (D and E) and E9.5 (F) reveals expression in the developing neural folds (A, white arrowhead in; B and C, black arrowhead), along the neural tube (D and E, black arrowhead), in the primitive streak (A, arrow; C, asterisk), in the ectoplacental cone (B, arrow), in newly forming somites and in the first rhombomere (C, arrow). At later stage (F), expression is restricted to the ventro-medial region of the neural tube (arrowhead), somites, optic and otic vesicles, the regions of the first branchial arch, the olfactory placode and developing limb buds (asterisk). Bright-field views of sections from whole mount (G–I) and postembedded in situ radioactive hybridizations (K–P) are also shown. Transverse sections confirmed expression in the cephalic neural folds (prospective forebrain; G, black arrowhead; E8.25), in the neuroepithelium of prospective hind brain (G, white arrowhead) and more caudally in the ventro-medial region of the neural tube (I, arrowhead; stage E8.25; K, arrow; stage E10.5). Coronal (H, stage E9.5) and sagittal (M, stage E10.5) sections show REN expression in the neuroepithelium of the fourth ventricle and of the diencephalon (H, asterisks) of the rhomboencephalic (Rh), mesencephalic (Mes), and telencephalic (Te) vesicles (M, arrowhead), in the olfactory placode including the epithelium lining the olfactory pit (M) and in the optic vesicle and stalk (H, white arrowhead; M, arrow). At later stages, REN expression characterizes more defined territories within the outer neuropeithelium layers of the midbrain and of the ventricular zone (VZ) of the cortical plate (L at stage E12.5; N; O, arrowhead; at stage E16.5). Some low and diffuse REN staining is also observed in the whole brain area (N). In the E16.5 embryo, outside of the brain REN expression was detected in dorsal root ganglia (N; P, arrowhead), preceded by expression in neural crest-derived spinal primordia (K, arrowhead). REN is also expressed in the trigeminal ganglion (O, asterisk) and in mesenchime of the maxillary component of the first branchial arch containing trigeminal neural crest tissue (H, black arrowhead). (J) RT-PCR analysis of REN expression in primary cultures of neural cells explanted from E9.5 embryonal neural tubes, cultured for 24 h (lane 1) and in differentiated N2a cells (lane 3), whereas no expression is detected in thymocytes isolated from newborn mice (lane 2).
Figure 5.
Figure 5.
REN induces cell growth arrest. (A) Cell growth arrest in P19, N2a, and ST14A cells transfected with expression vector pCXN2-REN-myc or with GFP expression vector. BrdU was added 24 h after transfection and detected after 2–24 h of incorporation. The percentage of BrdU incorporating cells in the REN+ or in the GFP+ population, was determined by coimmunostaining with anti-myc epitope and anti-BrdU antibodies or with anti-GFP and anti-BrdU antibodies and immunofluorescence microscopy. Average (± SEM) percentages of BrdU positive cells from three independent experiments performed in triplicate are shown. (B) Expression of p27Kip1 in control (GFP-transfected cells, GFP) and REN cDNA-transfected cells (REN) 48 h after transfection into P19, N2a, and ST14A cells. The percentage of p27Kip1 positive cells in the REN+ and in the GFP+ population, was determined by coimmunostaining with anti-myc epitope or anti-GFP antibodies and by immunofluorescence microscopy. Average (± SEM) percentages of p27Kip1 positive cells from three independent experiments performed in triplicate are shown. (C) Western blot analysis of p27Kip1 and α-tubulin expression in control (GFP-transfected, GFP) and REN cDNA-transfected N2a cells (REN), 48 h after transfection. (D) Exogenous expression of REN enhances p27Kip1 expression in N2a and ST14A cells. Confocal microscopy of coimmunostaining of p27Kip1 (red) and either myc epitope (green, REN) or GFP (green, GFP), in either GFP- (GFP) or REN-transfected (REN) cells, 48 h after transfection.
Figure 6.
Figure 6.
Abrogation of REN expression reduces the levels of Neurogenin1 and NeuroD. (A) Western-blot of endogenous REN and protein encoded by transfected pCXN2-REN (REN) in P19 cells treated with RA, as described in B, and revealed using anti-REN antibody. (B) Northern blot analysis of RNA isolated from P19 cells stably transfected with either REN cDNA cloned in antisense orientation into pCXN2 (P19-REN-AS) or empty vector P19-pCXN2 and treated with RA as described in Fig. 1 A. Blots were hybridized with cDNA probes for neurogenin-1, NeuroD, Math1, Mash1, Id1, and Id3, as indicated on each panel. Ethydium bromide staining of ribosomal RNA is shown as a loading control.
Figure 7.
Figure 7.
Exogenous expression of REN enhances neuronal marker expression in ST14A and N2a neural progenitor cells. Confocal microscopy of combined coimmunostaining of MAP2 or TuJ1 (red) and either myc epitope (green) or GFP (green; overlapping signals are yellow). (A) Untransfected (SFM) or GFP-transfected (GFP + SFM) ST14A cells grown in SFM for 7 d display a differentiated morphology and positive staining for MAP2. Cells transfected with GFP encoding expression vector and cultured in growth medium for 7 d, display GFP immunofluorescence and no staining for MAP2 (GFP panel). Cells transfected with myc epitope-tagged REN protein encoding vector and cultured in growth medium for 7 d, display coexpression of both myc epitope and MAP2 immunofluorescence (REN panels). (B) N2a cells transfected with REN expression vector (REN) display coexpression of REN and either MAP2 or TuJ1, 3 d after transfection. In contrast, cells transfected with GFP encoding expression vector and cultured for 3 d, display GFP immunofluorescence and no staining for either MAP2 or TuJ1. The pictures shown are from a representative experiment (out of three) with MAP2 or TuJ1 expression scored from 150 to 300 transfected cells examined.

References

    1. Bain, G., F.C. Mansergh, M.A. Wride, J.E. Hance, A. Isogawa, S.L. Rancourt, W.J. Ray, Y. Yoshimura, T. Tsuzuki, D.I. Gottlieb, and D.E. Rancourt. 2000. ES cell neural differentiation reveals a substantial number of novel ESTs. Funct. Integr. Genomics. 1:127–139. - PubMed
    1. Bang, O.S., E.K. Park, S.I. Yang, S.R. Lee, T.F. Franke, and S.S. Kang. 2001. Overexpression of Akt inhibits NGF-induced growth arrest and neuronal differentiation of PC12 cells. J. Cell Sci. 114:81–88. - PubMed
    1. Bardwell, V.J., and R. Treisman. 1994. The POZ domain: a conserved protein-protein interaction motif. Genes Dev. 8:1664–1677. - PubMed
    1. Bayer, S.A., and J. Altman. 1991. Neocortical Development. Raven, New York. 272 pp.
    1. Boudjelal, M., R. Taneja, S. Matsubara, P. Bouillet, P. Dollé, and P. Chambon. 1997. Overexpression of Stra13, a novel retinoic acid-inducible gene of the basic helix-loop-helix family, inhibits mesodermal and promotes neuronal differentiation of P19 cells. Genes Dev. 11:2052–2065. - PMC - PubMed

Publication types

MeSH terms

Associated data