. 2002 Sep;76(18):9096-102.
doi: 10.1128/jvi.76.18.9096-9102.2002.

Effect of altering the tRNA(Lys)(3) concentration in human immunodeficiency virus type 1 upon its annealing to viral RNA, GagPol incorporation, and viral infectivity

Affiliations

Effect of altering the tRNA(Lys)(3) concentration in human immunodeficiency virus type 1 upon its annealing to viral RNA, GagPol incorporation, and viral infectivity

Juliana Gabor et al. J Virol. 2002 Sep.

Abstract

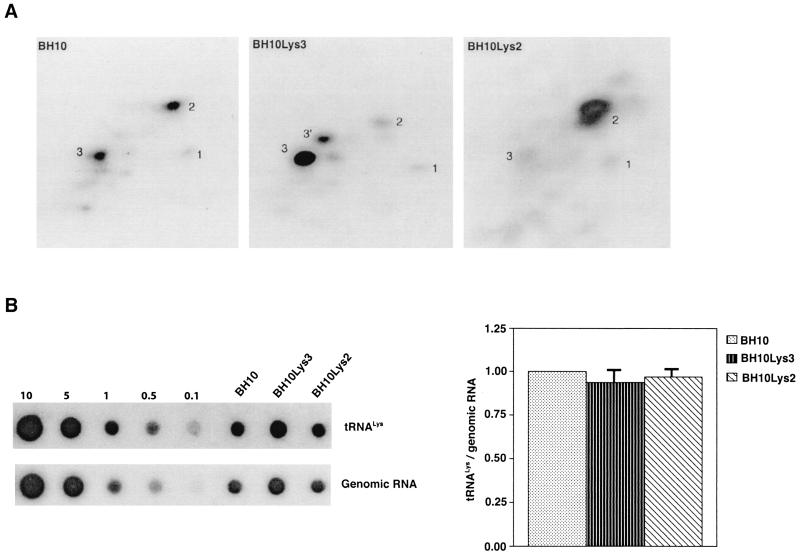
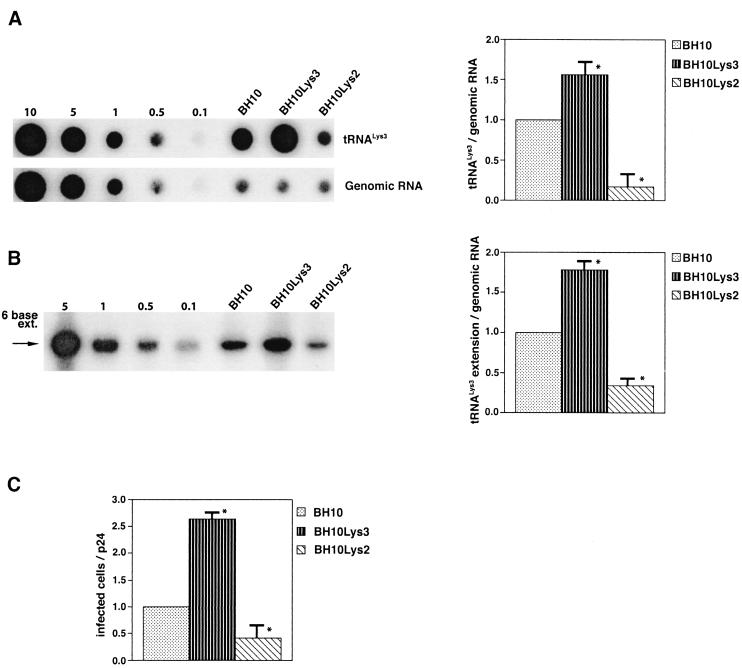
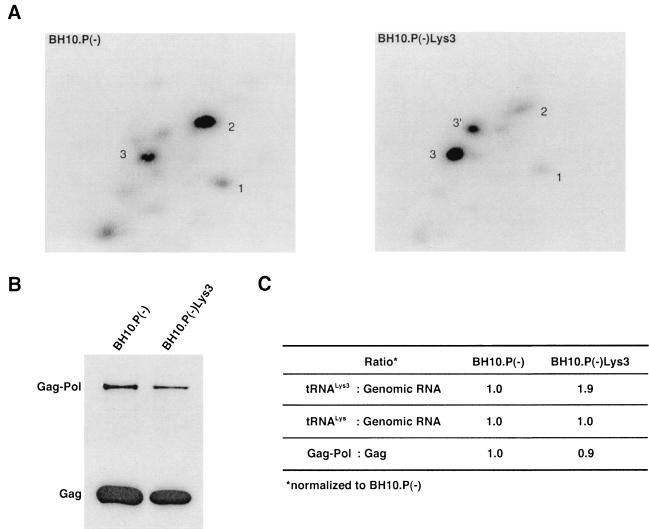
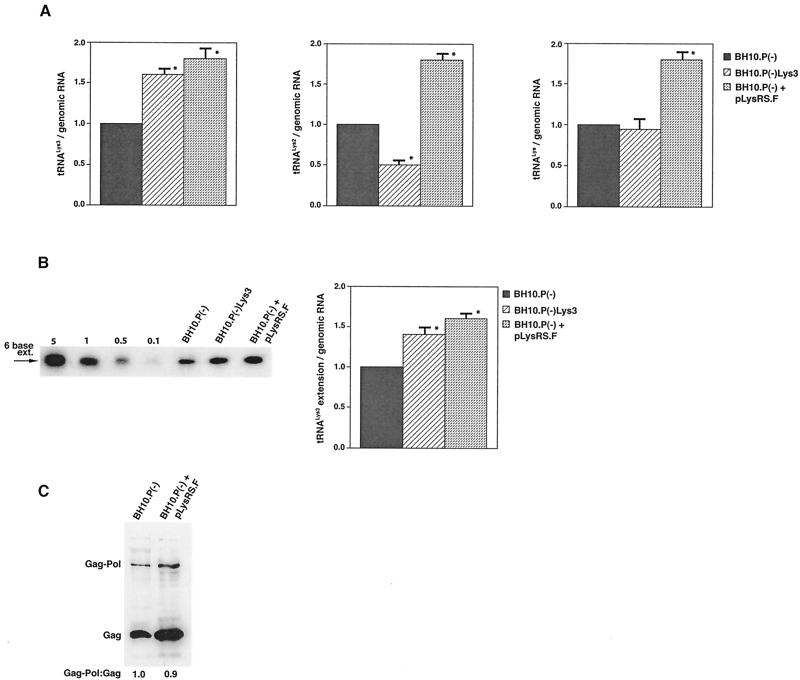
Human immunodeficiency virus type 1 (HIV-1) uses tRNA(Lys)(3) as a primer for reverse transcription and, during viral assembly, this tRNA is selectively packaged into the virus along with the other major tRNA(Lys), tRNA(Lys)(3). Increasing the cytoplasmic concentration of tRNA(Lys)(3) through transfection of cells with a plasmid containing both HIV-1 proviral DNA and a tRNA(Lys)(3) gene results in a greater incorporation of tRNA(Lys)(3) into virions, which is accompanied by increased annealing of tRNA(Lys)(3) to the viral genome and increased infectivity of the viral population. Increased viral tRNA(Lys)(3) is accompanied by decreased viral tRNA(Lys)(3), with the total tRNA(Lys)/virion and the GagPol/Gag ratios remaining unchanged. Viral tRNA(Lys) can be doubled, with increases in both tRNA(Lys)(3) and tRNA(Lys)(1,2) concentrations, by overexpressing lysyl tRNA synthetase. This also results in increased tRNA(Lys)(3) annealing to the viral RNA and increased viral infectivity but, again, no change in the GagPol/Gag ratio was observed. This result indicates that GagPol, whose interaction is required during packaging, is not a limiting factor during tRNA(Lys) incorporation into HIV-1, whereas LysRS is.


Figures

FIG. 1.
FIG. 1.
Alteration of tRNALys in HIV-1 as a result of overexpression of tRNAformula imageor tRNAformula image. Wild-type viruses were produced from COS7 cells transfected with BH10, BH10Lys3, or BH10Lys2, and total viral RNA was extracted. (A) 2D-PAGE analysis of low-molecular-weight viral RNA. Total viral RNA was 3′ end labeled with [32P]pCp and then electrophoresed in 11% polyacrylamide in the first dimension and in 20% polyacrylamide in the second dimension. Only low-molecular-weight RNA moves into the gel and is detected by autoradiography. Spots 3 and 3′, tRNAformula image; spots 1 and 2, tRNAformula image(partial sequencing of these two spots does not distinguish between tRNA1Lys and tRNA2Lys, which differ by only 1 bp in the anticodon stem). BH10, wild-type HIV-1 produced from cells transfected with a plasmid containing wild-type HIV-1 proviral DNA; BH10Lys3, HIV-1 produced from cells transfected with a plasmid containing both HIV-1 proviral DNA and a human gene for tRNAformula image; BH10Lys2, HIV-1 produced from cells transfected with a plasmid containing both HIV-1 proviral DNA and a human gene for tRNA,Lys. The pattern indicates that tRNA2Lys is found in spot 2 and not spot 1. (B) Analysis of the viral concentrations of tRNALys. Dot blots of viral RNA (containing 3 × 10⁸ to 10 × 108 copies genomic RNA) were hybridized with DNA probes complementary to both tRNAformula imageand tRNAformula imageor to viral genomic RNA. Hybridization signals were analyzed by phosphorimaging, and the tRNALys (both tRNAformula imageand tRNAformula image)/genomic RNA ratio was determined for virions produced from cells transfected with BH10, BH10Lys3, or BH10Lys2. The standard curves shown in the left part of the blot in panel B contain a dilution series of BH10 viral RNA, hybridized with the DNA probes complementary to either tRNALys or genomic RNA. The statistical analyses used here include column statistics and one-way ANOVA, where n = 3 and P < 0.05.
FIG. 2.
FIG. 2.
Effect of tRNAformula imageconcentrations in wild-type virions upon tRNAformula imageannealing and viral infectivity. Wild-type viruses were produced from COS7 cells transfected with BH10, BH10Lys3, or BH10Lys2. (A) Total viral RNA was extracted, and dot blots of viral RNA were hybridized with DNA probes complementary to either tRNAformula imageor viral genomic RNA. Hybridization signals were analyzed by phosphorimaging, and the tRNAformula image/genomic RNA ratio was determined for virions produced from cells transfected with BH10, BH10Lys3, or BH10Lys2. The standard curves shown in the left part of the blots were generated as described for Fig. 1B. (B) tRNAformula imageannealing to viral RNA. Total viral RNA was extracted and used as the source of primer tRNAformula image/genomic RNA template in an in vitro reverse transcription reaction, carried out in the presence of α-32P-labeled dGTP; dCTP, dTTP, and ddATP are not labeled. This will result in a six-base extension product since the first six bases incorporated are CTGCTA. Products were analyzed by 1D-PAGE, with samples containing equal amounts of genomic RNA. The standard curve shown in the left part of the blot in panel B contains a dilution series of total BH10 viral RNA, which is used as the source of primer or template. Statistical analyses employed in panels A and B include column statistics and one-way ANOVA, where n = 3 and P < 0.05. ✽, Statistically significant differences. (C) Viral infectivity. Infectivity was determined by using the MAGI assay as described in the text.
FIG. 3.
FIG. 3.
Alteration of tRNAformula imagein protease-negative HIV-1 as a result of overexpression of tRNAformula image. Protease-negative viruses were produced from COS7 cells transfected with BH10.P(−) or BH10.P(−)Lys3. (A) 2D-PAGE analysis of low-molecular-weight viral RNA. Total viral RNA was 3′ end labeled with [32P]pCp and then electrophoresed. Conditions for 2D-PAGE and labeling of spots is as described in Fig. 2A. (B) Western blots of viral lysates, probed with anti-CA and anti-RT. The results, quantitated by phosphorimaging, are listed in panel C as the GagPol/Gag ratios. (C) Incorporation of tRNALys into HIV-1. Dot blots of viral RNA were hybridized with DNA probes complementary to tRNAformula imagealone, to tRNALys (both tRNAformula imageand tRNAformula image), and to viral genomic RNA. The results were quantitated by phosphorimaging, and the tRNAformula image/genomic RNA or tRNALys/genomic RNA ratios are listed in panel C.
FIG. 4.
FIG. 4.
The effect of overexpression of LysRS upon tRNALys incorporation and annealing, GagPol incorporation, and viral infectivity. Protease-negative viruses were produced from COS7 cells transfected with BH10.P(−) or BH10.P(−)Lys3 or cotransfected with BH10.P(−) and pLysRS.F. (A) tRNALys incorporation. Dot blots of viral RNA were hybridized with DNA probes complementary to either tRNAformula imageor tRNAformula imagealone, to tRNALys (both tRNAformula imageand tRNAformula image), and to viral genomic RNA. The results were quantitated by phosphorimaging, and the ratios of tRNAformula image, tRNAformula image, or tRNALys to genomic RNA are plotted for the three viral types. Statistical analyses of the results are as described in the legend to Fig. 1. (B) tRNAformula imageannealing to viral RNA. Total viral RNA was extracted and used as the source of primer tRNAformula image/genomic RNA template in an in vitro reverse transcription reaction, as described for Fig. 1B. Products were analyzed by 1D-PAGE with samples containing equal amounts of genomic RNA. Generation of the standard curve and statistical analyses of the results are as described in the legend to Fig. 2B. (C) Western blots of viral lysates, probed with anti-CA and anti-RT. The results, quantitated by phosphorimaging, are listed as the GagPol/Gag ratios beneath each lane.

References

    1. Faras, A. J., and N. A. Dibble. 1975. RNA-directed DNA synthesis by the DNA polymerase of Rous sarcoma virus: structural and functional identification of 4S primer RNA in uninfected cells. Proc. Natl. Acad. Sci. USA 72:859-863. - PMC - PubMed
    1. Fu, W., A. Ortiz-Conde, R. J. Gorelick, S. H. Hughes, and A. Rein. 1997. Placement of tRNA primer on the primer binding site requires pol gene expression in avian but not murine retroviruses. J. Virol. 71:6940-6946. - PMC - PubMed
    1. Harada, F., G. G. Peters, and J. E. Dahlberg. 1979. The primer tRNA for Moloney murine leukemia virus DNA synthesis: nucleotide sequence and aminoacylation of tRNAPro. J. Biol. Chem. 254:10979-10985. - PubMed
    1. Harada, F., R. C. Sawyer, and J. E. Dahlberg. 1975. A primer RNA for initiation of in vitro Rous sarcoma virus DNA synthesis: nucleotide sequence and amino acid acceptor activity. J. Biol. Chem. 250:3487-3497. - PubMed
    1. Huang, Y., J. Mak, Q. Cao, Z. Li, M. A. Wainberg, and L. Kleiman. 1994. Incorporation of excess wild-type and mutant tRNA3Lys into HIV-1. J. Virol. 68:7676-7683. - PMC - PubMed

Publication types

LinkOut - more resources