

In vivo modulation of nonphotochemical exciton quenching (NPQ) by regulation of the chloroplast ATP synthase
- PMID: 12192092
- PMCID: PMC130538
- DOI: 10.1073/pnas.182427499
In vivo modulation of nonphotochemical exciton quenching (NPQ) by regulation of the chloroplast ATP synthase
Abstract
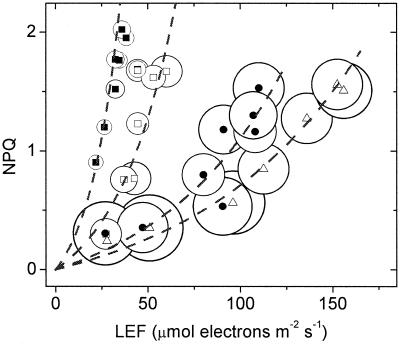
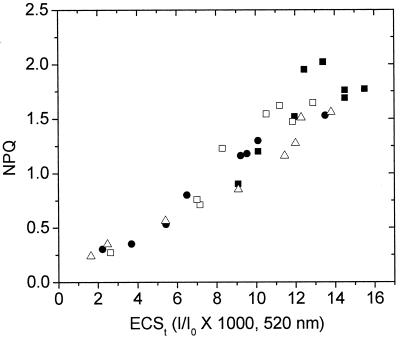
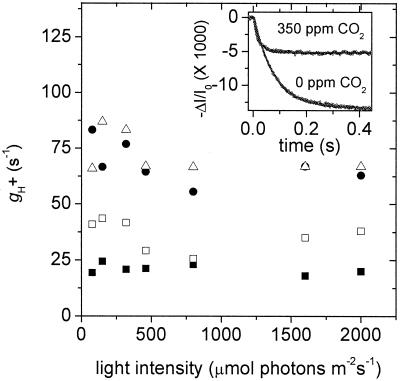
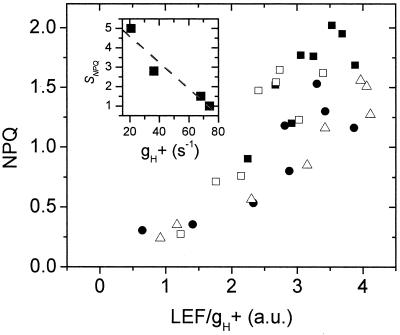
Nonphotochemical quenching (NPQ) of excitation energy, which protects higher plant photosynthetic machinery from photodamage, is triggered by acidification of the thylakoid lumen as a result of light-induced proton pumping, which also drives the synthesis of ATP. It is clear that the sensitivity of NPQ is modulated in response to changing physiological conditions, but the mechanism for this modulation has remained unclear. Evidence is presented that, in intact tobacco or Arabidopsis leaves, NPQ modulation in response to changing CO(2) levels occurs predominantly by alterations in the conductivity of the CF(O)-CF(1) ATP synthase to protons (g(H)(+)). At a given proton flux, decreasing g(H)(+) will increase transthylakoid proton motive force (pmf), thus lowering lumen pH and contributing to the activation of NPQ. It was found that an approximately 5-fold decrease in g(H)(+) could account for the majority of NPQ modulation as atmospheric CO(2) was decreased from 2,000 ppm to 0 ppm. Data are presented that g(H)(+) is kinetically controlled, rather than imposed thermodynamically by buildup of DeltaG(ATP). Further results suggest that the redox state of the ATP synthase gamma-subunit thiols is not responsible for altering g(H)(+). A working model is proposed wherein g(H)(+) is modulated by stromal metabolite levels, possibly by inorganic phosphate.
Figures
Comment in
-
A new regulatory role for the chloroplast ATP synthase.Proc Natl Acad Sci U S A. 2002 Oct 1;99(20):12518-9. doi: 10.1073/pnas.212515699. Epub 2002 Sep 23. Proc Natl Acad Sci U S A. 2002. PMID: 12271147 Free PMC article. No abstract available.
Similar articles
-
Depletion of stromal P(i) induces high 'energy-dependent' antenna exciton quenching (q(E)) by decreasing proton conductivity at CF(O)-CF(1) ATP synthase.Plant Cell Environ. 2008 Feb;31(2):235-43. doi: 10.1111/j.1365-3040.2007.01753.x. Epub 2007 Nov 29. Plant Cell Environ. 2008. PMID: 17996016
-
Modulation of energy-dependent quenching of excitons in antennae of higher plants.Proc Natl Acad Sci U S A. 2004 Apr 13;101(15):5530-5. doi: 10.1073/pnas.0401269101. Epub 2004 Apr 2. Proc Natl Acad Sci U S A. 2004. PMID: 15064404 Free PMC article.
-
Inactivation of the chloroplast ATP synthase gamma subunit results in high non-photochemical fluorescence quenching and altered nuclear gene expression in Arabidopsis thaliana.J Biol Chem. 2004 Jan 9;279(2):1060-9. doi: 10.1074/jbc.M308435200. Epub 2003 Oct 23. J Biol Chem. 2004. PMID: 14576160
-
Computer modeling of electron and proton transport in chloroplasts.Biosystems. 2014 Jul;121:1-21. doi: 10.1016/j.biosystems.2014.04.007. Epub 2014 May 14. Biosystems. 2014. PMID: 24835748 Review.
-
Toward an understanding of the mechanism of nonphotochemical quenching in green plants.Biochemistry. 2004 Jul 6;43(26):8281-9. doi: 10.1021/bi0494020. Biochemistry. 2004. PMID: 15222740 Review.
Cited by
-
Electron and proton transport in wheat exposed to salt stress: is the increase of the thylakoid membrane proton conductivity responsible for decreasing the photosynthetic activity in sensitive genotypes?Photosynth Res. 2021 Dec;150(1-3):195-211. doi: 10.1007/s11120-021-00853-z. Epub 2021 Jun 14. Photosynth Res. 2021. PMID: 34125427 Free PMC article.
-
BIOGENESIS FACTOR REQUIRED FOR ATP SYNTHASE 3 Facilitates Assembly of the Chloroplast ATP Synthase Complex.Plant Physiol. 2016 Jun;171(2):1291-306. doi: 10.1104/pp.16.00248. Epub 2016 Apr 18. Plant Physiol. 2016. PMID: 27208269 Free PMC article.
-
Photorespiration provides the chance of cyclic electron flow to operate for the redox-regulation of P700 in photosynthetic electron transport system of sunflower leaves.Photosynth Res. 2016 Sep;129(3):279-90. doi: 10.1007/s11120-016-0267-5. Epub 2016 Apr 26. Photosynth Res. 2016. PMID: 27116126
-
Fast cyclic electron transport around photosystem I in leaves under far-red light: a proton-uncoupled pathway?Photosynth Res. 2010 Feb;103(2):79-95. doi: 10.1007/s11120-009-9513-4. Epub 2009 Dec 29. Photosynth Res. 2010. PMID: 20039131
-
Water-stress induced downsizing of light-harvesting antenna complex protects developing rice seedlings from photo-oxidative damage.Sci Rep. 2018 Apr 13;8(1):5955. doi: 10.1038/s41598-017-14419-4. Sci Rep. 2018. PMID: 29654242 Free PMC article.
References
-
- Kramer D M, Sacksteder C A, Cruz J A. Photosynth Res. 1999;60:151–163.
-
- Anderson B, Aro E-M. In: Regulation of Photosynthesis. Anderson B, Aro E-M, editors. Dordrecht, The Netherlands: Kluwer; 2001. pp. 377–393.
-
- Hirada Y, Sonoike K. In: Regulation of Photosynthesis. Anderson B, Aro E-M, editors. Dordrecht, The Netherlands: Kluwer; 2001. pp. 507–531.
-
- Demmig-Adams B, Adams W W., III Plant Physiol. 1992;43:599–626.
-
- Horton P, Ruban A, Walters R. Annu Rev Plant Physiol Plant Mol Biol. 1996;47:655–684. - PubMed
Publication types
MeSH terms
Substances
LinkOut - more resources
Full Text Sources
