. 2002 Aug;3(2):259-70.
doi: 10.1016/s1534-5807(02)00216-2.

Spatio-temporal regulation of Rac1 localization and lamellipodia dynamics during epithelial cell-cell adhesion

Affiliations

Spatio-temporal regulation of Rac1 localization and lamellipodia dynamics during epithelial cell-cell adhesion

Jason S Ehrlich et al. Dev Cell. 2002 Aug.

Abstract

Cadherin-dependent epithelial cell-cell adhesion is thought to be regulated by Rho family small GTPases and PI 3-kinase, but the mechanisms involved are poorly understood. Using time-lapse microscopy and quantitative image analysis, we show that cell-cell contact in MDCK epithelial cells coincides with a spatio-temporal reorganization of plasma membrane Rac1 and lamellipodia from noncontacting to contacting surfaces. Within contacts, Rac1 and lamellipodia transiently concentrate at newest sites, but decrease at older, stabilized sites. Significantly, Rac1 mutants alter kinetics of cell-cell adhesion and strengthening, but not the eventual generation of cell-cell contacts. Products of PI 3-kinase activity also accumulate dynamically at contacts, but are not essential for either initiation or development of cell-cell adhesion. These results define a role for Rac1 in regulating the rates of initiation and strengthening of cell-cell adhesion.


Figures
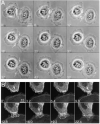
Figure 1
Figure 1. Cell-Cell Contact in MDCK Cells Is Driven by Waves of Lamellipodia and Is Accompanied by Rapid Cortical Actin Reorganization
(A) Time-lapse, phase contrast microscopy of cells undergoing cell-cell contact. Arrows indicate several sites of lamellipodia extension at the contact site. (B) Time-lapse, two-photon microscopy of cell-cell adhesion between cells expressing GFP-actin. The cortical actin ring dissolves into a complex actin meshwork at the cell-cell contact site (arrows). Note that the top cell expresses more GFP-actin than the lower cell, which allows better visualization of actin filament dynamics at contacting membranes. The figure displays selected panels from QuickTime movies available online. Time is indicated in minutes. Scale bars are in microns.
Figure 2
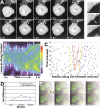
Figure 2. Dynamics of RacGFP Distribution during Cell-Cell Contact
(A) Time-lapse confocal microscopy of RacGFP-expressing MDCK epithelial cells. Double arrows, RacGFP at contacting membranes; arrowheads, lamellipodia; asterisks, site of initial (and hence oldest) contact. The figure displays selected panels from QuickTime movies available online. Time is indicated as hr: (B) Higher magnification of frames from (A). Scale bars are in microns. (C) Time intensity position (TIP) analysis of the cell-cell contact from (A). RacGFP signal intensities across the cell-cell contact (demarcated by the red line in [B]) were measured over time and encoded on a pseudocolor scale. X and Y axes represent time and position along the cell-cell contact, respectively. GFP signal intensity at the contacting membrane is normalized against the average GFP intensity of noncontacting membranes, so TIP scans from different cells may be compared. Arrows indicate the cell-cell contact boundaries. Color bar: black, lowest GFP intensity; white, highest intensity.
Figure 3
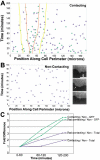
Figure 3. Lamellipodia Formation Dynamics during Cell-Cell Adhesion
(A) A map of the distribution of lamellipodia around a contacting cell. Distance around the cell perimeter from an origin was identified in microns; the cell is “unwrapped” along a single line for each movie frame to represent data on a linear plot. The cell-cell contact zone is within the red lines, and the 10 micron perimeter bordering the contact is outlined in yellow. Data are presented for the cell shown in Figure 2. Blue plus green marks, complete data set (all protrusions); green marks alone, protrusions that contained RacGFP. (B) A map of the distribution of lamellipodia around a noncontacting cell. The panels display three consecutive movie frames; lamelli-podia were identified as transient membrane protrusions seen in frame-by-frame analysis (arrow). The scale bar represents 5 μm. (C) Ratio of protrusions occurring within the contact or pericontact region versus the non-contacting region, normalized for the respective membrane areas of each region. The relative number of lamellipodia within the contacting region becomes higher during development of cell-cell adhesion.
Figure 4
Figure 4. Morphological Effects of Dominant-Negative Rac1 Expression on Cell-Cell Contact Development
(A) Left panels, time-lapse confocal microscopy of MDCK cells transiently expressing Rac1T17NGFP. The figure displays selected panels from QuickTime movies available online. Time is indicated as hr:min and site of contact as arrowheads. The scale bar represents 15 μm. Right panels, RacT17NGFP-expressing cells have smaller membrane protrusions than wild-type RacGFP-expressing cells; an example is shown in three consecutive video frames. The scale bar represents 5 μm. (B) TIP analysis of the cell-cell contact from (A). GFP signal intensities across the cell-cell contact (demarcated by the red line in [A]) were measured over time and encoded as in Figure 2. This panel is presented with the same pseudocolor intensity scale as Figure 2C, and can be compared directly. (C) Lamellipodia mapping analysis of the RacT17NGFP cell-cell contact from (A). (D) Ratio of protrusions occurring within the contact or pericontact region versus the noncontacting region, normalized for membrane areas. (E) Time-lapse movie of Rac1Q61LGFP-expressing MDCK cells during cell-cell adhesion. Most cells exhibit promiscuous lamellipodia extension and fail to migrate (asterisk). Unusually broad lamellipodia were observed between contacting cells, and contacts extended faster than in wild-type RacGFP cells. The figure displays selected stills from a QuickTime movie available online. Time is indicated as hr:min. The scale bar represents 20 μm.
Figure 5
Figure 5. Expression of Dominant-Negative Rac1 Reduces Accumulation of Wild-Type RacGFP at Cell-Cell Contacts
(A) RacGFP (arrow) and myc-tagged RacT17N expressed in the same cells. Wild-type RacGFP fails to accumulate at cell-cell contacts in many such cells (arrow), whereas Rac1T17N is present. (B) In some cases, wild-type RacGFP is present at contacting membranes but only at a level similar to that at noncontacting membranes of the same cell (left cell, compare membranes marked by arrows and asterisks). Cells with higher expression of RacGFP and lower expression of Rac1T17N (right cell, arrowheads) showed accumulation of GFP at the contact site in addition to Rac1T17N.
Figure 6
Figure 6. Spatio-Temporal Dynamics of PH-GFP and Effect of PI 3-Kinase Blockade during Cell-Cell Adhesion
(A) Time-lapse confocal movie of cells expressing PH-GFP. PI 3-kinase activity is observed in lamellipodia on non-cell-cell contacting surfaces (black arrows) and more strongly at lamellipodia of cell-cell contacts (red arrows). Following addition of 20 μM LY-294002, PH-GFP intensity sharply decreases at cell-cell contact sites (+LY in panels) but cell-cell contacts are maintained. (B) TIP scan analysis of the movie from (A). LY-294002 was added at the time indicated by the asterisks. (C) LY-294002 added at initiation of cell-cell contact does not prevent subsequent contact growth. The figure displays selected stills from QuickTime movies available online. Time is indicated as hr:min. The scale bars represent 15 μm.
Figure 7
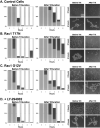
Figure 7. Analysis of Rac1 in a Quantitative, Functional Adhesion Assay
Control cells (A), Rac1T17N cells (B), Rac1G12V cells (C), and LY-294002-treated cells (D). Graphs show the percentage of cells in clusters of 0–10 cells (gray), 11–50 cells (dark gray), and >50 cells (light gray) at the time points indicated, before and after trituration. For each time point, 200–400 cells were scored and data are presented as the average of three independent experiments. Photographs are representative fields at 0 and 4 hr, before and after trituration. The scale bar represents 200 μm.

References

    1. Adams CL, Nelson WJ. Cytomechanics of cadherin-mediated cell-cell adhesion. Curr. Opin. Cell Biol. 1998;10:572–577. - PubMed
    1. Adams CL, Chen YT, Smith SJ, Nelson WJ. Mechanisms of epithelial cell-cell adhesion and cell compaction revealed by high-resolution tracking of E-cadherin-green fluorescent protein. J. Cell Biol. 1998;142:1105–1119. - PMC - PubMed
    1. Ahmari SE, Buchanan J, Smith SJ. Assembly of presynaptic active zones from cytoplasmic transport packets. Nat. Neurosci. 2000;3:445–451. - PubMed
    1. Akhtar N, Hotchin NA. RAC1 regulates adherens junctions through endocytosis of E-cadherin. Mol. Biol. Cell. 2001;12:847–862. - PMC - PubMed
    1. Akhtar N, Hudson KR, Hotchin NA. Co-localization of Rac1 and E-cadherin in human epidermal keratinocytes. Cell Adhes. Commun. 2000;7:465–476. - PubMed

Publication types

MeSH terms