

Plane of cell cleavage and numb distribution during cell division relative to cell differentiation in the developing retina
- PMID: 12196575
- PMCID: PMC6757979
- DOI: 10.1523/JNEUROSCI.22-17-07518.2002
Plane of cell cleavage and numb distribution during cell division relative to cell differentiation in the developing retina
Abstract
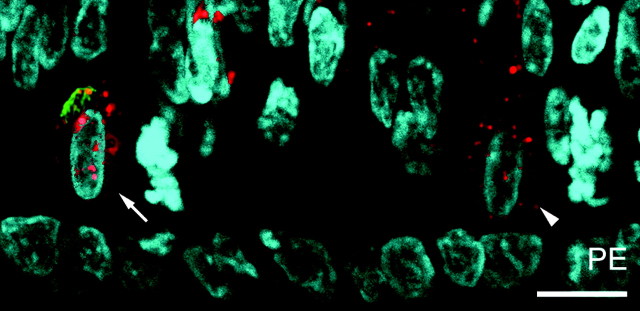
Progenitor cells in the early developing nervous system can divide symmetrically, giving rise to two daughter cells that divide again, or asymmetrically, giving rise to one cell that differentiates and one that divides again. It has been suggested that the orientation of the cell cleavage plane during mitosis determines the type of division. A marker of early cell differentiation, the RA4 antigen, was used to identify regions of the developing chick retina with and without differentiating cells, and the orientation of the cleavage plane was characterized for mitotic figures in each region. No difference was found in the frequency of any orientation between the regions with or without differentiating cells. Furthermore, in the region of the retina with differentiating cells, the RA4 antigen was present in mitotic figures with every possible orientation. Thus, the orientation of the cleavage plane appears to be unrelated to whether or not a division produces a cell that differentiates. It has also been suggested that the intracellular protein Numb mediates neurogenesis via asymmetric localization during cell division. Numb localization was compared with expression of markers of early cell differentiation, the RA4 antigen and Delta. Differentiating and nondifferentiating cells were found both with and without Numb expression. Cells with a cleavage plane parallel to the retinal surface were polarized, such that Numb and/or the RA4 antigen, when present, were only in the daughter cell farthest from the ventricle. These findings indicate a need to reconsider current hypotheses regarding the key features underlying symmetric and asymmetric divisions in the developing nervous system.
Figures


Similar articles
-
Asymmetric segregation of Numb in retinal development and the influence of the pigmented epithelium.J Neurosci. 2001 Aug 1;21(15):5643-51. doi: 10.1523/JNEUROSCI.21-15-05643.2001. J Neurosci. 2001. PMID: 11466435 Free PMC article.
-
Asymmetric segregation of Numb and Prospero during cell division.Nature. 1995 Oct 19;377(6550):624-7. doi: 10.1038/377624a0. Nature. 1995. PMID: 7566172
-
The orientation of cell division influences cell-fate choice in the developing mammalian retina.Development. 2003 Jun;130(11):2329-39. doi: 10.1242/dev.00446. Development. 2003. PMID: 12702648
-
Asymmetric cell division.Curr Opin Cell Biol. 2004 Apr;16(2):195-205. doi: 10.1016/j.ceb.2004.02.010. Curr Opin Cell Biol. 2004. PMID: 15196564 Review.
-
Asymmetric segregation of the Drosophila numb protein during mitosis: facts and speculations.Cold Spring Harb Symp Quant Biol. 1997;62:71-7. Cold Spring Harb Symp Quant Biol. 1997. PMID: 9598338 Review. No abstract available.
Cited by
-
Interkinetic nuclear migration and the selection of neurogenic cell divisions during vertebrate retinogenesis.J Neurosci. 2007 Sep 19;27(38):10143-52. doi: 10.1523/JNEUROSCI.2754-07.2007. J Neurosci. 2007. PMID: 17881520 Free PMC article.
-
Influences on neural lineage and mode of division in the zebrafish retina in vivo.J Cell Biol. 2005 Dec 19;171(6):991-9. doi: 10.1083/jcb.200509098. J Cell Biol. 2005. PMID: 16365165 Free PMC article.
-
Loss of citron kinase affects a subset of progenitor cells that alters late but not early neurogenesis in the developing rat retina.Invest Ophthalmol Vis Sci. 2015 Jan 15;56(2):787-98. doi: 10.1167/iovs.14-15272. Invest Ophthalmol Vis Sci. 2015. PMID: 25593024 Free PMC article.
-
Analysis of retinal cell development in chick embryo by immunohistochemistry and in ovo electroporation techniques.BMC Dev Biol. 2010 Jan 20;10:8. doi: 10.1186/1471-213X-10-8. BMC Dev Biol. 2010. PMID: 20089190 Free PMC article.
-
Spatiotemporal features of neurogenesis in the retina of medaka, Oryzias latipes.Dev Dyn. 2008 Dec;237(12):3870-81. doi: 10.1002/dvdy.21797. Dev Dyn. 2008. PMID: 19035349 Free PMC article.
References
-
- Ahmad I, Dooley CM, Polk DL. Delta-1 is a regulator of neurogenesis in the vertebrate retina. Dev Biol. 1997;185:92–103. - PubMed
-
- Alexiades MR, Cepko CL. Subsets of retinal progenitors display temporally regulated and distinct biases in the fates of their progeny. Development. 1997;124:1119–1131. - PubMed
-
- Chenn A, McConnell SK. Cleavage orientation and the asymmetric inheritance of Notch1 immunoreactivity in mammalian neurogenesis. Cell. 1995;82:631–642. - PubMed
Publication types
MeSH terms
Substances
Grants and funding
LinkOut - more resources
Full Text Sources