. 2002 Sep 1;22(17):7569-79.
doi: 10.1523/JNEUROSCI.22-17-07569.2002.

Purinergic and muscarinic modulation of the cell cycle and calcium signaling in the chick retinal ventricular zone

Affiliations

Purinergic and muscarinic modulation of the cell cycle and calcium signaling in the chick retinal ventricular zone

Rachel Pearson et al. J Neurosci. .

Abstract

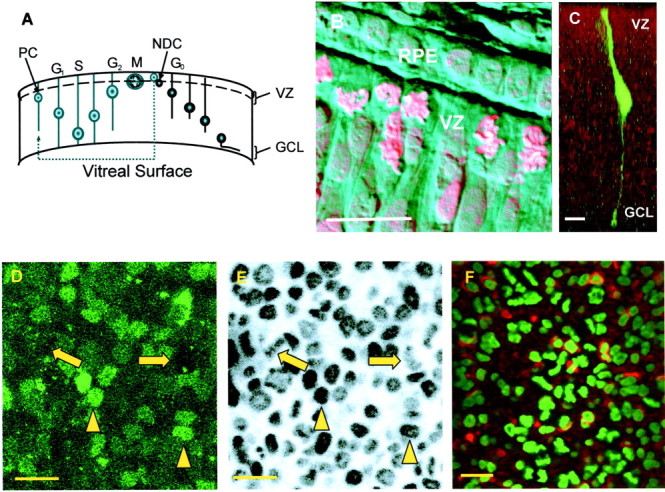
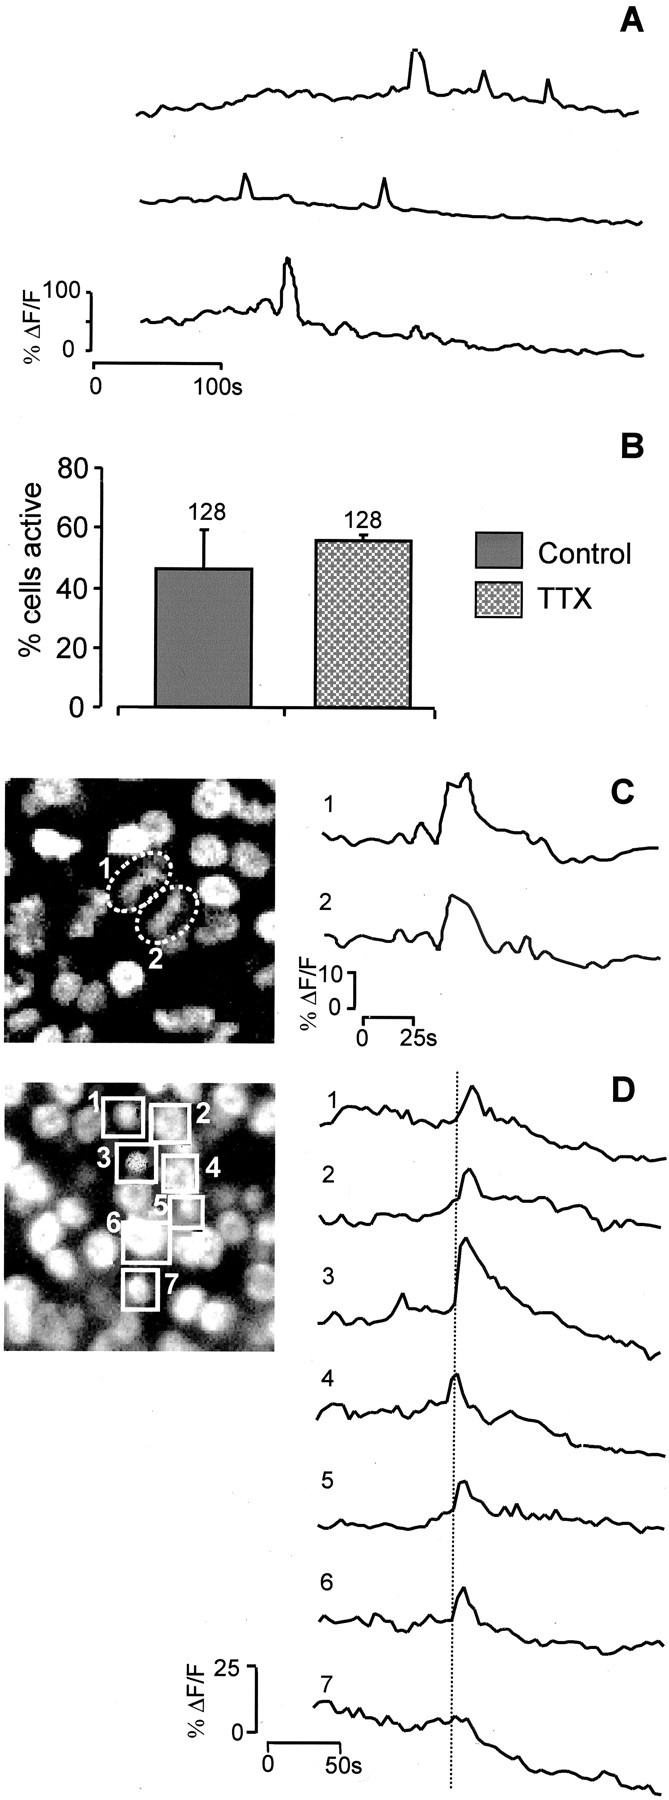
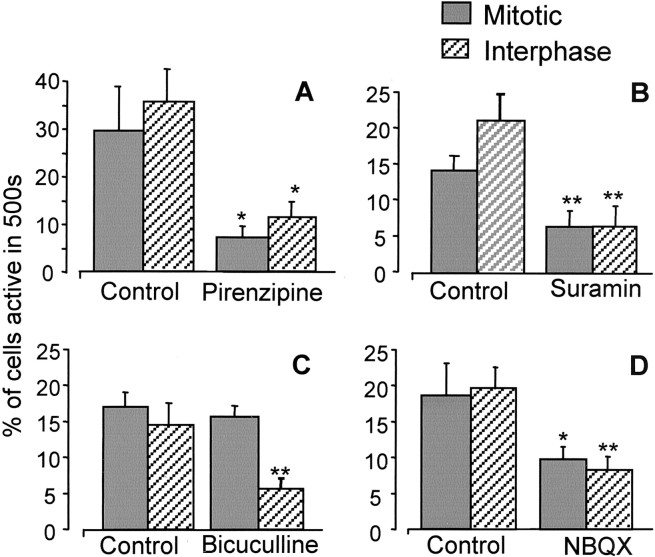
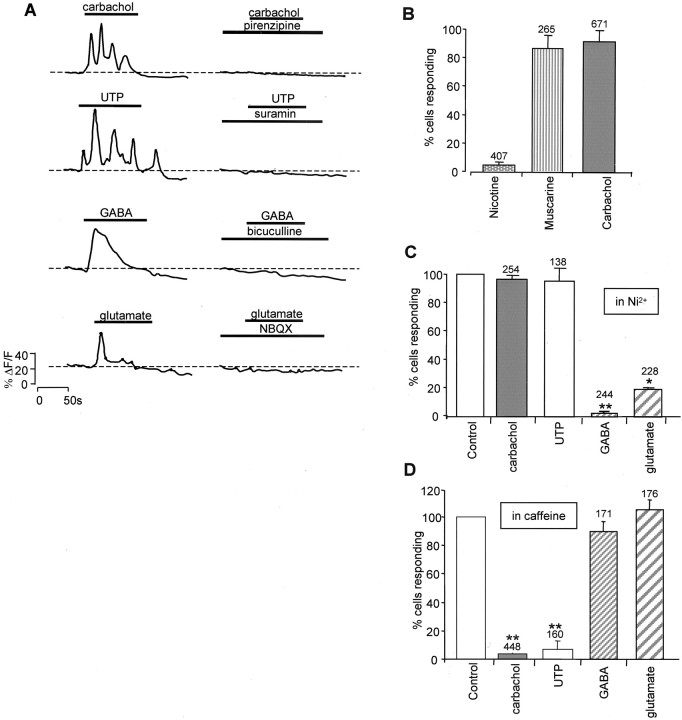
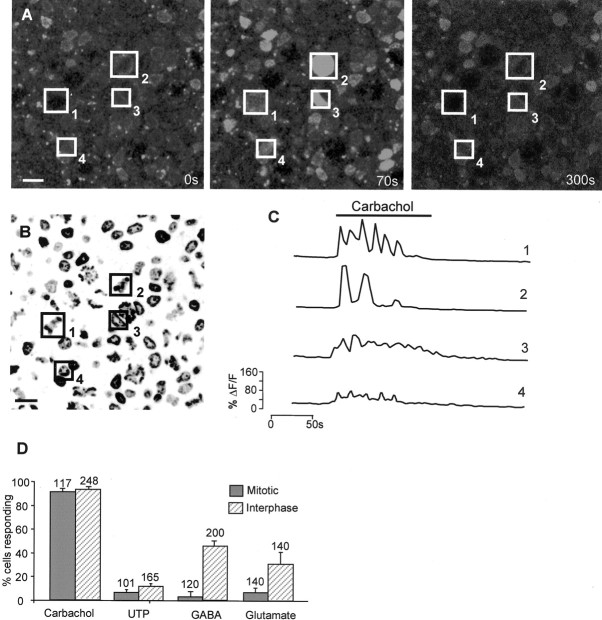
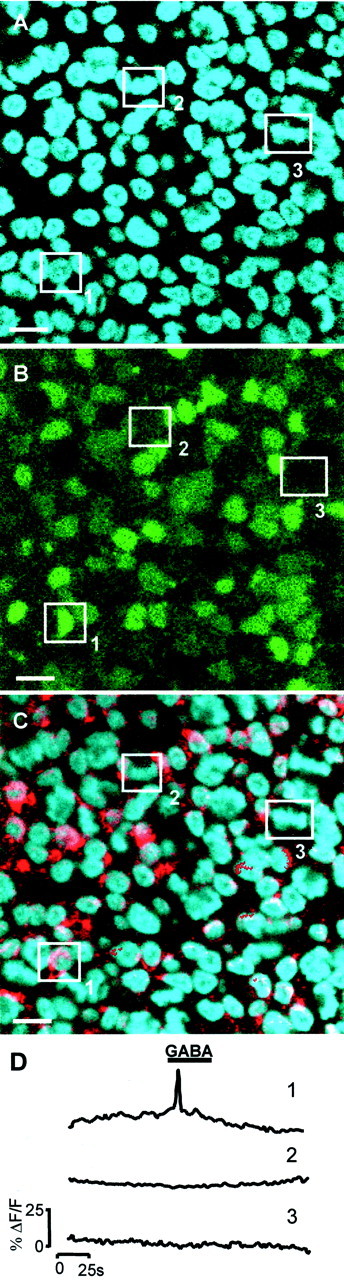
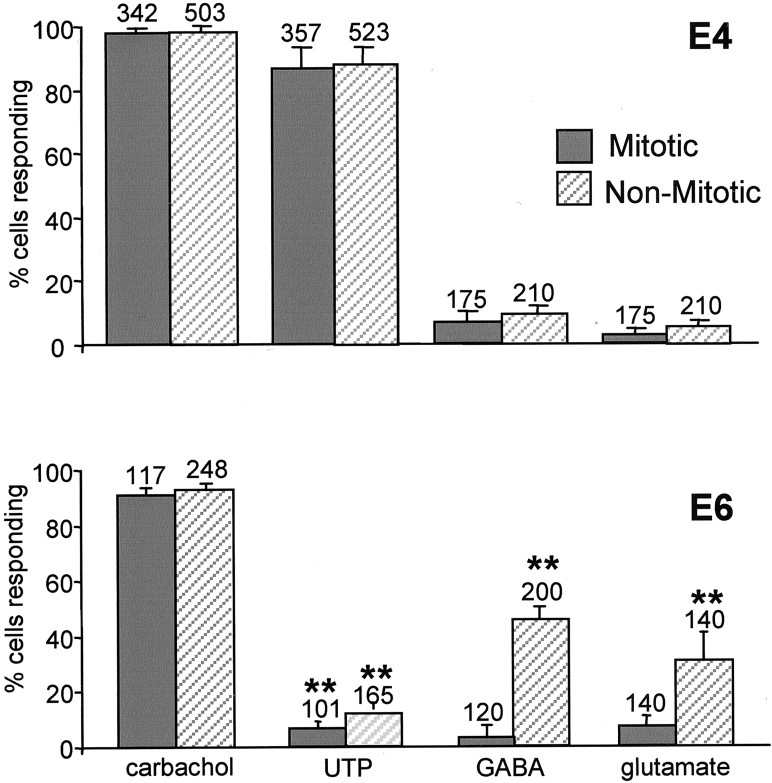
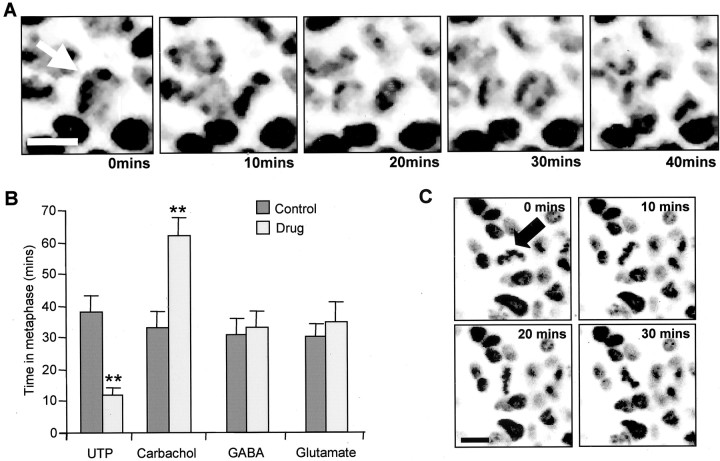
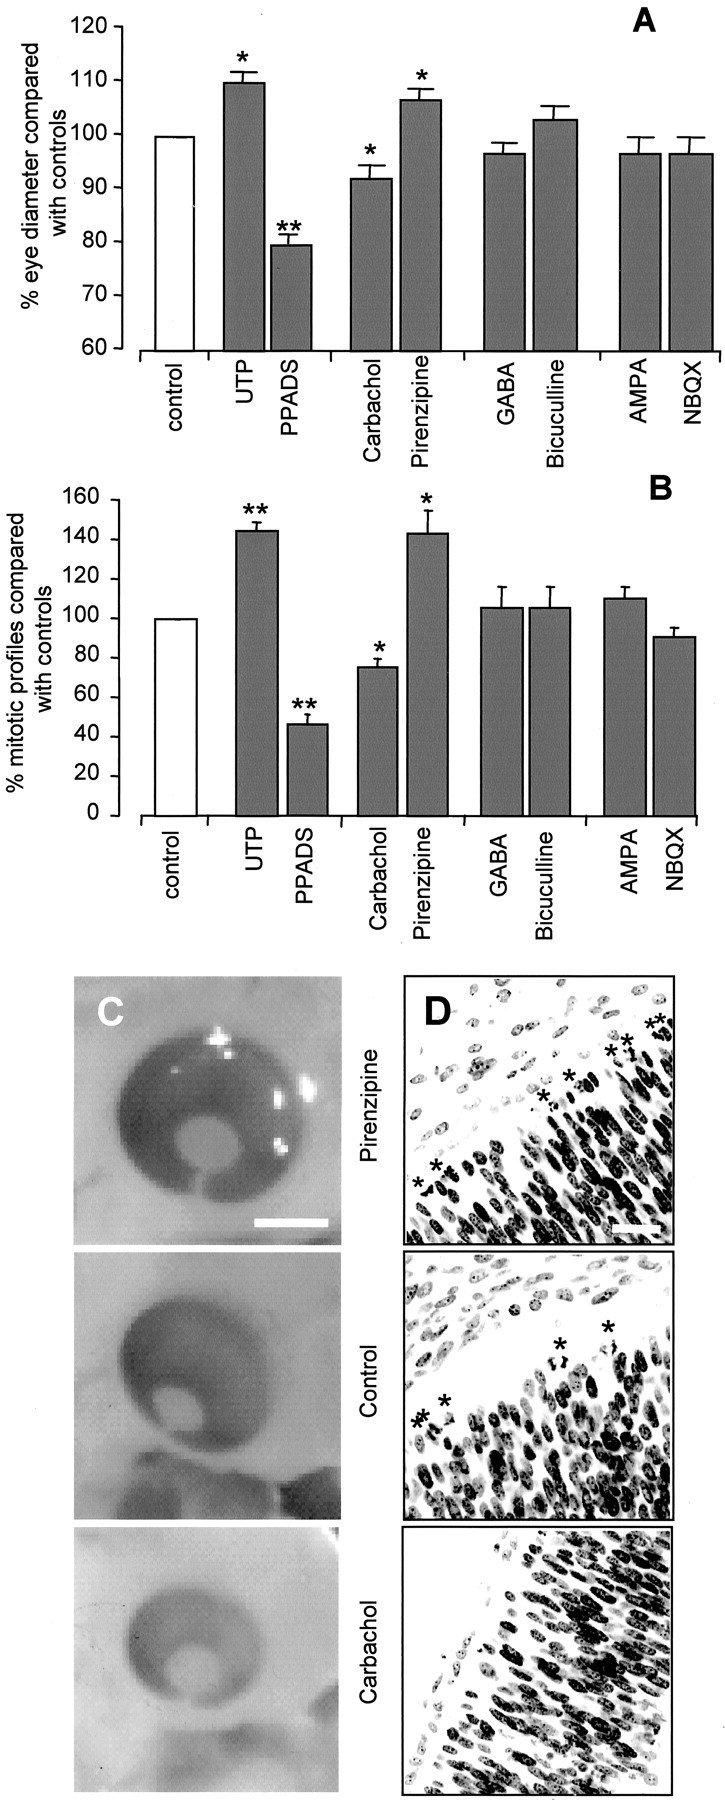
Spontaneous calcium transients occur in the ventricular zone of the chick retina and result from the endogenous release of neurotransmitters in the absence of action potentials. Calcium transients resulting from the activation of purinergic and muscarinic receptors occur in a mixed population of interphase and mitotic cells, whereas those produced by ionotropic GABA and glutamate receptors are mostly restricted to the interphase population, the GABA responses primarily coming from cells that express the neuronal marker TuJ-1. Muscarinic and purinergic receptors can act respectively as a brake and an accelerator on mitosis, whereas GABA and glutamate receptors are without effect. Our results suggest that the balance between muscarinic and purinergic activation acts to control the rate of retinal proliferation in early development.


Figures

Fig. 1.
Fig. 1.
The cell cycle in the chick retina.A, Progenitor cells (PC) undergo interkinetic nuclear migration. In this process, the nucleus moves between the VZ, which is permissive for mitosis (M), and the GCL. The nucleus moves toward the GCL in G1, replicates its DNA (S phase), and returns toward the VZ in G2. Throughout this period, the cell retains contact with both surfaces of the retina by means of thin cytoplasmic processes. During the transition from G2 to M phase, the cell retracts its vitreal process before dividing. PCs can either undergo symmetrical division, in which both daughter cells continue in the cell cycle, or divide asymmetrically to give rise to a PC and a newly differentiated cell (NDC) that then migrates to its final location. B, Combined phase contrast and fluorescence image of a section through an E6 chick retina, stained with propidium iodide. Mitotic cells are confined to the VZ and contact the RPE. Mitotic cells can be identified by the presence of strongly staining and highly condensed chromatin that contrasts with the weakly stained and dispersed chromatin of the interphase cells. C, Single PC injected with FITC and dextran to show the processes that extend to the ventricular and vitreal surfaces. The nucleus of the cell is located in the bulge within the cell below the VZ. D, E, VZ cells can be labeled with both Fluo-4 AM, to measure their [Ca2+]i responses, and Hoechst 33342, to determine their mitotic status. D, In Fluo-4-labeled preparations, two distinct populations of cells can be identified within the VZ. Large, dark cells (arrows) with an average diameter of 4.6 ± 0.2 μm (n = 80;N = 3) and smaller, more brightly labeled ones (arrowheads) of 2.7 ± 0.2 μm (n = 80; N = 3) in diameter. Cells were viewed at resting [Ca2+]i.E, Same cells shown in A labeled with Hoechst 33342 (2 μm). The large profiles contain condensed chromatin and are mitotic (arrows). The chromatin within the nuclei of the brightly labeled and smaller cells is typical of cells in interphase (arrowheads). F, VZ of an E6 retina labeled with TuJ-1 (red), an antibody for neuron-specific tubulin, and Hoechst 33342 (green). Approximately one-third of the interphase cells of the VZ are TuJ-1 positive (see Results). Scale bars, 10 μm.
Fig. 2.
Fig. 2.
Spontaneous [Ca2+]i transients in E6 VZ cells.A, Examples of the spontaneous changes in [Ca2+]iF/F) seen in individual cells in the VZ when the temperature is raised to 37°C. In any given cell, events occurred approximately once every 250 sec (n = 99; N = 3) and had durations of 13.8 ± 1.3 sec. B, The frequency of spontaneous events is not reduced by the Na+ channel blocker TTX (10 μm;N = 3).C, Paired event occurring between cells (1, 2) before cytokinesis. Left panel, Hoechst 33342 labeling showing the state of the chromatin in cells 1 and2. D, Transients may spread to invade several cells. Seven interphase (1–7) cells are highlighted in the left panel (Hoechst 33342 labeling), and the change in [Ca2+]i is plotted in the traces (right). The [Ca2+]i transient observed is initiated in cell4 and spreads to either side of it.
Fig. 3.
Fig. 3.
Spontaneous activity results from endogenous activation of neurotransmitter receptors. Graphs show the mean ± SEM percent of a randomly selected sample of 500 cells demonstrating spontaneous activity within 500 sec in control solution or in the presence of 25 μm pirenzipine (A), suramin (B), bicuculline (C), or NBQX (D). *p < 0.05; **p < 0.01. All retinas were E6, except with suramin (see Results), at which E4 retinas were used.N = 5; n = 500 in each condition.
Fig. 4.
Fig. 4.
VZ cells in E6 retina respond to muscarinic, purinergic, glutamatergic, and GABAergic stimulation. A, Left, Exogenous application of carbachol, UTP, GABA, and glutamate (all 100 μm) produces increases in [Ca2+]i; 94 ± 2% (n = 671; N = 10) of cells responded to carbachol; 11 ± 5% (n = 210;N = 6) responded to UTP; 35 ± 8% (n = 240; N = 6) responded to GABA; and 39 ± 11% (n = 280;N = 6) responded to glutamate. The responses to GABA and glutamate were usually transient and declined monotonically with time, whereas those to UTP and carbachol were often oscillatory.A, Right, Responses to carbachol, UTP, GABA, and glutamate were suppressed by pirenzipine, suramin, bicuculline, and NBQX (all 25 μm), respectively. B, The response to carbachol is mediated by muscarinic receptors. Muscarine (100 μm;N = 4) produces responses in the same proportion of cells as carbachol (100 μm;N = 7), whereas nicotine (100 μm;N = 6) stimulates only a small number. C, D, The [Ca2+]i increase resulting from muscarinic and purinergic stimulation results from Ca2+ release from intracellular stores, whereas that from glutamatergic and GABAergic stimulation results from Ca2+ entry through VOCCs. C, Ni2+ (100 μm) greatly reduces the effects of GABAergic (N = 3) and glutamatergic (N = 3) stimulation but is without effect on responses to either UTP (N = 3) or carbachol (N = 3). D, Ten millimolar caffeine greatly reduces the fraction of cells that respond to either muscarinic (N = 6) or purinergic (N = 3) stimulation but is without effect on responses to either GABA (N = 3) or glutamate (N = 3). Values plotted are the mean ± SEM; **p < 0.01.
Fig. 5.
Fig. 5.
The mitotic and interphase VZ cell populations respond to different agonists. A–C, Changes in [Ca2+]i can be correlated with the mitotic status of individual cells. A, Confocal image of flat-mount E6 retina labeled with Fluo-4 AM. Four cells are indicated by numbered boxes and show increased fluorescence in the presence of carbachol (center panel).Left, center, and rightpanels correspond to 0, 70, and 300 sec, respectively.B, Hoechst 33342 image of the same region shown inA reveals that cells1 and2 are mitotic, and 3 and 4are in interphase. Scale bar, 5 μm. C, Changes in [Ca2+]iF/F) in cells1–4 during drug application.D, At E6, most cells respond to carbachol, and smaller numbers respond to UTP, GABA, and glutamate. Responses to UTP (100 μm) and carbachol (100 μm) arose equally from the mitotic and the interphase populations, whereas those to GABA (100 μm) and glutamate (100 μm) were predominantly from the interphase cells. Values plotted are mean ± SEM; N = 4.
Fig. 6.
Fig. 6.
The responses to GABA arise primarily from newly differentiated neurons. A–C, Single confocal sections through the VZ of the same region within an E6 chick retina.A, Hoechst 33342 staining to show the mitotic status of cells (cell indicated by box 1 is in interphase; those in boxes 2 and3 are mitotic). B, Fluo-4 image taken during the application of GABA (100 μm).C, Identification of differentiating neurons using TuJ-1 conjugated with Cy5 (red) and Hoechst 33342 (blue). The same three cells are highlighted throughout. Scale bar, 5 μm. D, Change in [Ca2+]iF/F) in cells1–3 in response to GABA.Cell1 is in interphase, is TuJ-1 positive, and responds to GABA; cell 2 is in interphase, is TuJ-1 negative, and does not respond to GABA; and cell 3 is mitotic, is TuJ-1 negative, and does not respond to GABA.
Fig. 7.
Fig. 7.
Developmental changes in sensitivity to neurotransmitter stimulation. A, Proportion of mitotic and interphase cells in the VZ responding to carbachol, UTP, GABA, and glutamate (all 100 μm) in E4 chick retina.B, Response to the same agonists at E6. Values are mean ± SEM; carbachol, N = 12; UTP,N = 12; GABA, N = 8; glutamate,N = 6 for E4; N = 4 at E6 for all agonists; *p < 0.05; **p< 0.01 (E4 compared with E6 in each category).
Fig. 8.
Fig. 8.
Time spent in metaphase is affected by muscarinic and purinergic stimulation but not by GABA or glutamate.A, Confocal images of VZ cells labeled with Hoechst 33342 taken at 10 min intervals. The chromosomes of the mitotic cell shown by the arrow enter metaphase during this period and pull apart in the transition from metaphase to anaphase. Scale bar, 5 μm. B, Graph of the time (minutes) spent in metaphase in either control solution (filled bars) or the presence of 10 μm UTP, carbachol, GABA, or glutamate. Values are mean ± SEM; N> 4; **p < 0.01. C, Metaphase plates (arrowhead) also underwent rotations without separation during the period of observation (illustrated are 30 min).
Fig. 9.
Fig. 9.
Eye size and mitosis are affected by muscarinic and purinergic systems but not by GABA and glutamate in ovo. A, Effects of UTP (N = 4), PPADS (N = 4), carbachol (N= 6), pirenzipine (N = 10), GABA (N = 5), bicuculline (N = 5), glutamate (N = 5), and NBQX (N= 5) (antagonists, 25 μm; agonists, 50 μm), applied in ovo, on eye diameter, percent compared with controls. B, Effects of the same drugs on the number of mitotic figures in the VZ, percent compared with controls. Values are mean ± SEM; *p < 0.05; **p < 0.01. C, D, Examples of embryos treated with pirenzipine (top), control (center), and carbachol (bottom).C, Light microscopic images of whole eyes. Scale bar, 2 mm. D, Confocal images of retinal sections labeled with Hoechst 33342. *Mitotic cells. Cell density is unaffected (cells/5000 μm2: controls, 94–103; all drugs, 95–102;p = 0.37–0.99). Scale bar, 10 μm.

Similar articles

Cited by

References

    1. Antonopoulos J, Pappas IS, Parnavelas JG. Activation of the GABAA receptor inhibits the proliferative effects of bFGF in cortical progenitor cells. Eur J Neurosci. 1997;9:291–298. - PubMed
    1. Baumgold J, Dyer K. Muscarinic receptor-mediated inhibition of mitogenesis via a protein kinase C-independent mechanism in M1-transfected A9L cells. Cell Signal. 1994;6:103–108. - PubMed
    1. Catsicas M, Mobbs P. GABAb receptors regulate chick retinal calcium waves. J Neurosci. 2001;21:897–910. - PMC - PubMed
    1. Catsicas M, Bonness V, Becker D, Mobbs P. Spontaneous Ca2+ transients and their transmission in the developing chick retina. Curr Biol. 1998;8:283–286. - PubMed
    1. Ciapa B, Pesando D, Wilding M, Whitaker M.Cell-cycle calcium transients driven by cyclic changes in inositol trisphosphate levels. Nature 3681994875–878.0 - PubMed

Publication types

MeSH terms

LinkOut - more resources