. 2002 Sep 1;22(17):7680-6.
doi: 10.1523/JNEUROSCI.22-17-07680.2002.

Adenosine induces inositol 1,4,5-trisphosphate receptor-mediated mobilization of intracellular calcium stores in basal forebrain cholinergic neurons

Affiliations

Adenosine induces inositol 1,4,5-trisphosphate receptor-mediated mobilization of intracellular calcium stores in basal forebrain cholinergic neurons

Radhika Basheer et al. J Neurosci. .

Abstract

In the cholinergic basal forebrain, we found previously that the extracellular adenosine concentration increase that accompanies sleep deprivation, acting via the A1 receptor, led to activation of the transcription factor nuclear factor-kappaB and to the upregulation of A1 adenosine receptor mRNA. We thus began to examine intracellular signaling mechanisms. We report here that adenosine, acting in a dose-dependent manner and predominantly via A1 receptors, stimulated IP3 receptor-regulated calcium release from intracellular stores. To the best of our knowledge, this calcium signaling pathway effect is a novel action of the G(i)-coupled A1 adenosine receptor in neurons. Moreover, this calcium mobilization was not seen at all in noncholinergic neurons but was present in a large proportion of cholinergic neurons. These data suggest a potential role for a calcium-signaling pathway in adenosine-induced long-term effects of sleep deprivation and a key role for cholinergic neurons in this process.


Figures

Fig. 1.
Fig. 1.
Effect of adenosine on the intracellular calcium of BF neurons. A, Typical time course of calcium increase, measured as increase in calcium orange fluorescence in a live neuron in an acute slice after treatment with 100 μmadenosine (two photon microscope measurements every 1.37 sec).Insets, Photomicrographs of a cell at the indicated time points. Note that the maximal fluorescence is achieved by 45–60 sec, and note the size of the neuron. Scale bar, 25 μm. B, Time course of fluorescence of neurons in slices fixed at various times after adenosine treatment (100 μm).Insets, Photomicrographs of neurons in slices fixed at the indicated time points. Note the close correspondence to the time course of fluorescence in an unfixed neuron (A) and the sizes of the neurons. Scale bar, 50 μm. C, Adenosine concentration–response curve: adenosine concentrations and mean ± SEM fluorescence are shown (n = 11 neurons per point). Note that the maximum response is achieved at 100 μm adenosine, the concentration chosen for other experiments.
Fig. 2.
Fig. 2.
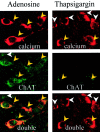
Adenosine-induced cytosolic calcium increase was seen only in cholinergic neurons of the BF. Left column, Effect of adenosine (60 sec) treatment. Right column, Effects of thapsigargin (60 sec) treatment. Top, The calcium orange fluorescence retained in the neurons after immunolabeling for ChAT. Middle, Immunolabeling of the same neurons for ChAT, detected using FITC-conjugated secondary antibody. Bottom, Overlay showing double fluorescence. Note the presence of calcium fluorescence primarily in cholinergic neurons with adenosine (yellow arrowhead). One cholinergic neuron in A (white arrowhead) does not show calcium orange fluorescence. Calcium orange fluorescence is increased in thapsigargin-treated slices (B) in both cholinergic (yellow arrowhead) and noncholinergic (white arrowhead) cells. Images were acquired separately in each channel (dual-scan mode) to eliminate the possibility of signal bleed-over from one channel to another.
Fig. 3.
Fig. 3.
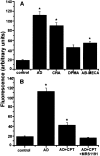
Cytosolic calcium increase in response to different adenosine (AD) receptor agonists:A, A significant increase in cytosolic calcium fluorescence was observed in response to adenosine. A similar response was obtained by treatment with the A1 agonist CHA compared with controls (p < 0.01). There was a twofold increase in cytosolic calcium fluorescence with treatment with the A3 agonist AB-MECA versus controls (p < 0.05), whereas the A2agonist DPMA had no significant effect. B, The effect of adenosine was significantly but partially blocked by pretreatment of slices with the A1-selective antagonist CPT (significantly lower than adenosine treatments but higher than controls;p < 0.05). However, combined use of CPT and the A3-selective antagonist MRS1191 rendered the adenosine response not significantly different from controls. Theasterisks describe a significant difference when compared with controls.
Fig. 4.
Fig. 4.
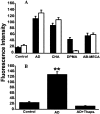
The adenosine (AD)-induced cytosolic increase in calcium is independent of calcium in the external medium. A, The changes in cytosolic fluorescence intensity were compared for slices in the presence and absence of calcium in the external medium for each treatment group.Filledbars denote the values observed in the presence of calcium, and open bars represent the values obtained in calcium-free medium. Kruskal–Wallis one-way ANOVA showed statistically significant differences between the groups (H = 173.77; df = 9; p < 0.001; post hoc analysis by Dunn's method was done for comparison of different treatment groups vs controls). Note that treatment with the adenosine A1agonist CHA as well as treatment with the A3 agonist AB-MECA resulted in increased mobilization of cytosolic calcium regardless of the presence of calcium in the external medium.B, Pretreatment of slices with 50 μmthapsigargin to deplete internal stores of calcium abolished the response to adenosine (p < 0.01). The asterisks describe a significant difference when compared with controls.
Fig. 5.
Fig. 5.
Inhibition of IP3R but not RyR blocks the effect of adenosine (AD) on intracellular calcium. A significant increase in intracellular calcium by adenosine (p < 0.01) was unaffected when RyR activity was blocked by DHBP. Conversely, blocking the IP3R with xestospongin C (XeC) or 2APB led to no response to adenosine treatment. The difference between the groups was significant by Kruskal–Wallis one-way ANOVA (H = 55.864; df = 4;p < 0.001; Dunn's post hocanalysis was done for multiple comparisons vs controls). Theasterisks describe a significant difference when compared with controls.

References

    1. Abbracchio MP, Brambilla R, Ceruti S, Kim HO, von Lubitz DK, Jacobson KA, Cattabeni F. G protein-dependent activation of phospholipase C by adenosine A3 receptors in rat brain. Mol Pharmacol. 1995;48:1038–1045. - PubMed
    1. Bading H. Transcription-dependent neuronal plasticity: the nuclear calcium hypothesis. Eur J Biochem. 2000;267:5280–5283. - PubMed
    1. Bading H, Ginty DD, Greenberg ME. Regulation of gene expression in hippocampal neurons by distinct calcium signaling pathways. Science. 1993;260:181–186. - PubMed
    1. Basheer R, Porkka-Heiskanen T, Stenberg D, McCarley RW. Adenosine and behavioral state control: adenosine increases c-Fos protein and AP1 binding in basal forebrain of rats. Brain Res Mol Brain Res. 1999;73:1–10. - PubMed
    1. Basheer R, Porkka-Heiskanen T, Strecker RE, Thakkar MM, McCarley RW. Adenosine as a biological signal mediating sleepiness following prolonged wakefulness. Biol Signals Recept. 2000;9:319–327. - PubMed

Publication types

MeSH terms

LinkOut - more resources