. 2002 Sep 1;22(17):7695-711.
doi: 10.1523/JNEUROSCI.22-17-07695.2002.

Anatomical, physiological, and pharmacological characteristics of histidine decarboxylase knock-out mice: evidence for the role of brain histamine in behavioral and sleep-wake control

Affiliations

Anatomical, physiological, and pharmacological characteristics of histidine decarboxylase knock-out mice: evidence for the role of brain histamine in behavioral and sleep-wake control

Régis Parmentier et al. J Neurosci. .

Abstract

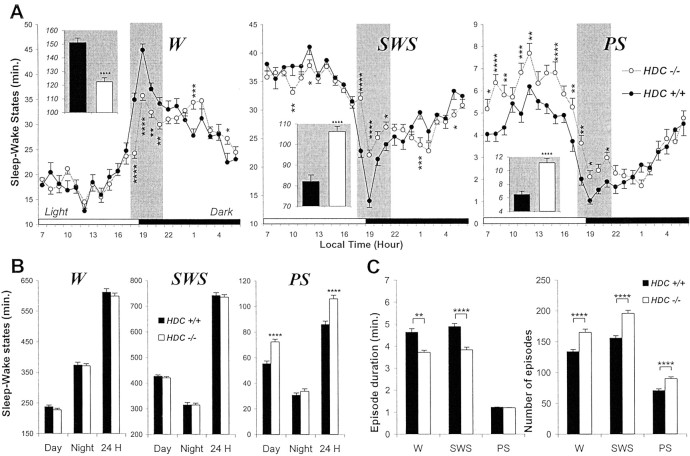
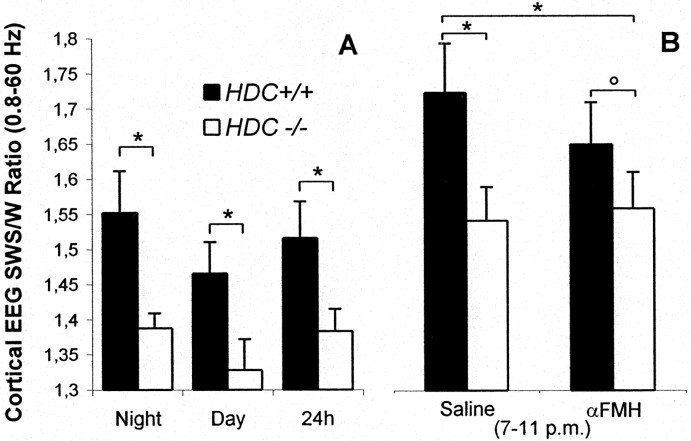
The hypothesis that histaminergic neurons are involved in brain arousal is supported by many studies. However, the effects of the selective long-term abolition of histaminergic neurons on the sleep-wake cycle, indispensable in determining their functions, remain unknown. We have compared brain histamine(HA)-immunoreactivity and the cortical-EEG and sleep-wake cycle under baseline conditions or after behavioral or pharmacological stimuli in wild-type (WT) and knock-out mice lacking the histidine decarboxylase gene (HDC-/-). HDC-/-mice showed an increase in paradoxical sleep, a decrease in cortical EEG power in theta-rhythm during waking (W), and a decreased EEG slow wave sleep/W power ratio. Although no major difference was noted in the daily amount of spontaneous W, HDC-/-mice showed a deficit of W at lights-off and signs of somnolence, as demonstrated by a decreased sleep latencies after various behavioral stimuli, e.g., WT-mice placed in a new environment remained highly awake for 2-3 hr, whereas HDC-/-mice fell asleep after a few minutes. These effects are likely to be attributable to lack of HDC and thus of HA. In WT mice, indeed, intraperitoneal injection of alpha-fluoromethylhistidine (HDC-inhibitor) caused a decrease in W, whereas injection of ciproxifan (HA-H3 receptor antagonist) elicited W. Both injections had no effect in HDC-/-mice. Moreover, PCR and immunohistochemistry confirmed the absence of the HDC gene and brain HA-immunoreactive neurons in the HDC-/-mice. These data indicate that disruption of HA-synthesis causes permanent changes in the cortical-EEG and sleep-wake cycle and that, at moments when high vigilance is required (lights off, environmental change em leader ), mice lacking brain HA are unable to remain awake, a prerequisite condition for responding to behavioral and cognitive challenges. We suggest that histaminergic neurons also play a key role in maintaining the brain in an awake state faced with behavioral challenges.


Figures

Fig. 1.
Fig. 1.
Quantitative comparison of spontaneous sleep–wake parameters in inbred HDC+/+ and HDC−/− mice. HDC+/+ mice,filled symbols and columns; HDC−/− mice, unfilled symbols and columns.A, Mean hourly values (± SE) of the sleep–wake states. The gray area corresponds to the period between 6:00 and 10:00 P.M., and the total sleep–wake values for each state during this period for both genotypes are indicated in the histogram.B, Means (± SE) of sleep–wake stages for the 12 hr light (Day) and dark (Night) periods and the 24 hr period. C, Mean values (± SE) of episode duration and number of episodes of each sleep–wake stage for all 24 hr recordings. Note that, compared with HDC +/+ mice, HDC −/− mice exhibit the following: (1) a deficit of W immediately before and after lights-off (A), without major change in the daily amount of W or SWS (B); (2) an increase in PS, mainly in the light phase, because of an increase in the number of episodes (A–C); and (3) a fragmented sleep–wake architecture, with shortened episode duration and increased number of episodes in W and SWS (C). Note also the small interindividual SDs for the sleep–wake stages within each genotype group, indicating that each group was genetically homogenous (n = 33, corresponding to 3 × 24 hr recordings for 11 animals of each genotype). *p < 0.05; **p < 0.01; ***p < 0.001; ****p <0.0001, using a two-tailedt test after significance in a two-way ANOVA for repeated measures).
Fig. 2.
Fig. 2.
Typical examples of polygraphic recordings and corresponding hypnograms illustrating the spontaneous sleep–wake cycle before and after lights-off and sleep–wake state transitions in HDC+/+ and HDC−/− mice. Samples on the hour range (A, B) or second range (a, b) scale from an HDC+/+ (A, a) or HDC−/− (B, b) mouse, showing the following: (1) the cortical EEG signs of both genotypes (a, b); and (2) the decreased waking (A, B) around the lights-off and reduced cortical electroencephalogram (EEG) SWS/W amplitude ratio (A, B, a, b) in the HDC−/− mouse. Calibration: 200 μV, 1 sec. EMG, Electromyogram.
Fig. 3.
Fig. 3.
Cortical EEG SWS/W power ratio (0.8–60 Hz) in HDC+/+ and HDC−/− mice during the night or day periods or over 24 hr of spontaneous recordings or during hours 3–7 after injection of saline or α-FMH. Filled columns, HDC+/+ mice;unfilled columns, HDC−/− mice. A, Values of spontaneous recordings (n = 11);B, values of recordings between 7:00 and 11:00 P.M. (n = 14) after injection of saline or α-FMH (50 mg/kg, i.p.) at 4:00 P.M. Note the significantly reduced ratio in HDC−/− mice during normal conditions (A) or after saline injection (B), and the lack of a significant difference between HDC+/+ and HDC−/− mice in the ratio after injection of α-FMH (B) (*p < 0.05, °p > 0.05; two-tailed t test).
Fig. 4.
Fig. 4.
Mean spectral distribution of cortical EEG power density in spontaneous sleep–wake states in inbred HDC+/+ and HDC−/− mice. The data were obtained from 14 pairs of animals by pooling consecutive 30 sec epochs during the period of 7:00–10:00 P.M. using the fast Fourier transform routine within the frequency range of 0.8–60 Hz. A1, A2, Mean absolute power values (in square microvolts) in each 0.4 Hz frequency bin. Note the state-dependent profiles of cortical EEG spectra across wakefulness (W), slow wave sleep (SWS), and paradoxical sleep (PS) in HDC+/+ (A1) and HDC−/− (A2) mice. B1–B3, Mean percentage power density calculated as the mean power (in square microvolts) in each 0.4 Hz frequency bin divided by the total power (0.8–60 Hz) in the same epoch. The spectra from HDC+/+ mice were set to the same apparent sizes to those of the same animals inA1 to facilitate comparison. The inset onB1 is enlarged view for 0.8–2.4 Hz. B4, EEG power spectra in HDC−/− mice (columns,n = 14) expressed as a mean percentage change (± SE) relative to those (± SE) in HDC+/+ mice (baseline 0;n = 14). Note that the HDC−/− mice show an increase in power density of cortical δ frequency (0.8–2.4 Hz) during W, a deficit of power density of cortical slow θ rhythm (3–9 Hz) during W and SWS, and an increase in power density of cortical fast rhythms (β+γ, 20–60 Hz) during SWS (*p < 0.05; **p <0.01; ***p <0.001; two-tailed t test).
Fig. 5.
Fig. 5.
Typical examples of polygraphic recordings and corresponding hypnograms illustrating the effects of an environmental change on HDC+/+ and HDC−/− mice. The environmental change (indicated by an arrow) consisted of moving the animals from their habitual transparent barrel cages to opaque rectangular cages at either 2:00 P.M. (sleepy period; top panels) or 6:00 P.M. (awake period; bottom panels). Note that the HDC +/+ mouse remained awake for >2 hr in the new environment, whereas the HDC−/− mouse fell asleep soon after the test.
Fig. 6.
Fig. 6.
Quantitative variations of sleep–wake states in HDC+/+ and HDC−/− mice after an environmental change. Top histograms (A, B), Mean values (± SE in minutes) of each sleep–wake stage during the 4 hr in which the animals were in the new environment compared with the baseline recordings for the same group. Bottom histograms (a, b), Sleep–wake changes (in minutes) relative to the baseline value for the same group. Left histograms (A, a), Environmental change at 2:00 P.M.; right histograms(B, b), change at 6:00 P.M. Note the significant increase in waking (W) and decrease in slow wave sleep (SWS) in HDC+/+ mice compared either with their own baseline values (A, B) or the values (bottom, a, b) for HDC−/− mice (n= 18 at 2:00 P.M. and 22 at 6:00 P.M. from 9 and 11 pairs of animals).PS, Paradoxical sleep; °p > 0.05; *p < 0.05, **p < 0.01, ***p < 0.001, ****p < 0.0001, two-tailed t test after significance in a two-way ANOVA for repeated measures.
Fig. 7.
Fig. 7.
Effects of α-FMH on sleep–wake states in HDC+/+ and HDC−/− mice. The curves show the mean hourly cumulative values (±SE) during the 7 hr after injection of α-FMH (50 mg/kg, i.p., at 4:00 P.M.) (filled symbols) or saline (unfilled symbols). Note the progressive decrease in wakefulness (W) and increase in both slow wave sleep (SWS) and paradoxical sleep (PS) in the HDC+/+ mice (left traces) but not the HDC−/− mice (right traces) (n = 14 from 7 pairs of mice; *p < 0.05, **p < 0.01; two-tailed t test after significance in two-way ANOVA for repeated measures).
Fig. 8.
Fig. 8.
Effects of ciproxifan on cortical EEG and sleep–wake states in HDC+/+ and HDC−/− mice. Top traces, HDC+/+ mice; bottom traces, HDC−/− mice. Examples of polygraphic recordings, cortical EEG power density (in square microvolts) in different frequency bands, and the corresponding hypnograms illustrating suppression of cortical EEG power at 0.8–8 (θ + δ) and 8–14 (α) Hz, marked enhancement of cortical fast rhythm (β+γ, 30–60 Hz), and a waking state induced by injection of ciproxifan (1 mg/kg, i.p, at 10:00 A.M., indicated by the arrow) in an HDC+/+ mouse but not in an HDC−/− mouse.
Fig. 9.
Fig. 9.
Quantitative variations in sleep–wake states in HDC+/+ and HDC−/− mice after ciproxifan injection. Top histogram, Mean values (± SE, in minutes) of each sleep–wake stage after injection of saline (control) or ciproxifan (1 mg/kg, i.p., at 10:00 A.M.). Bottom histograms,Sleep–wake changes (in minutes) relative to the baseline value for the same group. Note the significant increase in waking (W) and decrease in slow wave sleep (SWS) in HDC+/+ mice compared with either their own baseline values or those of HDC−/− mice (n = 9; for both). *p < 0.05; ***p < 0.001; ****p < 0.0001, two-tailed ttest).
Fig. 10.
Fig. 10.
PCR confirmation of genotypes. Lanes 1–15, HDC−/− mice; lanes 16–30, HDC+/+ mice. Note that all HDC+/+ mice displayed a 147 bp band corresponding to the HDC gene fragment, whereas all HDC −/−mice showed a 244 bp band corresponding to the Neor gene fragment.
Fig. 11.
Fig. 11.
Distribution of histamine-immunoreactive (HA-IR) neurons in the mouse hypothalamus. Photomicrographs of frontal sections showing HA-IR neurons in the mouse hypothalamus visualized using the immunofluorescent CyTM3 method. Note the presence of HA-IR cell bodies and fibers in the HDC+/+ mouse brain (left) and their absence in the HDC −/− mouse (right).3V, Third ventricle; CM, mammillary corpus; f, fornix; ipf, interpeduncular fossa; LH, lateral hypothalamic area;Mre, mammillary recess; PH, posterior hypothalamic area; SuM, supramammillary area;TMv and TMd, tuberomammillary nucleus, ventral and dorsal divisions. Scale bars, 100 μm.
Fig. 12.
Fig. 12.
Distribution of histamine-immunoreactive (HA-IR) cell bodies and fibers in the mouse CNS. Photomicrographs of frontal sections showing HA immunoreactivity visualized using immunofluorescent CyTM3 (dark-field photomicrographs) or PAP (light-field photomicrographs of sections counterstained with neutral red). Note, in HDC+/+ mice, but not HDC−/− mice, the presence of HA-IR fibers in the primary somatosensory cortex (S1), the diagonal band of Broca (BDB), and the substantia innominata (SI) of the basal forebrain, the geniculate nucleus of the thalamus (MG), and brainstem structures, such as the dorsal raphe nucleus (DR), substantia nigra (SN), locus coeruleus (LC), and laterodorsal tegmental nucleus (LDT). Also note the presence of HA-IR neurons in the brain section through the tuberomammillary nucleus (TMv) in the HDC+/+ mouse but not the HDC−/− mouse. Aq, Aqueduct of Sylvius;mlf, medial longitudinal fasciculus; cp, cerebral peduncle; scp, superior cerebellar peduncle. Scale bars, 100 μm.

Similar articles

Cited by

References

    1. Airaksinen MS, Panula P. The histaminergic system in the guinea pig central nervous system: an immunocytochemical mapping study using an antiserum against histamine. J Comp Neurol. 1988;273:163–186. - PubMed
    1. Airaksinen MS, Alanen S, Szabat E, Visser TJ, Panula P. Multiple neurotransmitters in the tuberomammillary nucleus: comparison of rat, mouse, and guinea pig. J Comp Neurol. 1992;323:103–116. - PubMed
    1. Bland BH. The physiology and pharmacology of hippocampal formation theta rhythms. Prog Neurobiol. 1986;26:1–54. - PubMed
    1. Borbély AA, Achermann P. Sleep homeostasis and models of sleep regulation. In: Kryger MH, Roth T, Dement WC, editors. Principles and practice of sleep medicine. Saunders; Philadelphia: 2000. pp. 377–390.
    1. Bouthenet ML, Ruat M, Sales N, Garbarg M, Schwartz JC. A detailed mapping of histamine H1-receptors in guinea-pig central nervous system established by autoradiography with [125I]iodobolpyramine. Neuroscience. 1988;26:553–600. - PubMed

Publication types

MeSH terms

LinkOut - more resources