Comparative Study
. 2002 Sep 2;21(17):4600-11.
doi: 10.1093/emboj/cdf468.

Structure and function of the BAH-containing domain of Orc1p in epigenetic silencing

Affiliations
Comparative Study

Structure and function of the BAH-containing domain of Orc1p in epigenetic silencing

Zhiguo Zhang et al. EMBO J. .

Abstract

The N-terminal domain of the largest subunit of the Saccharomyces cerevisiae origin recognition complex (Orc1p) functions in transcriptional silencing and contains a bromo-adjacent homology (BAH) domain found in some chromatin-associated proteins including Sir3p. The 2.2 A crystal structure of the N-terminal domain of Orc1p revealed a BAH core and a non-conserved helical sub-domain. Mutational analyses demonstrated that the helical sub-domain was necessary and sufficient to bind Sir1p, and critical for targeting Sir1p primarily to the cis-acting E silencers at the HMR and HML silent chromatin domains. In the absence of the BAH domain, approximately 14-20% of cells in a population were silenced at the HML locus. Moreover, the distributions of the Sir2p, Sir3p and Sir4p proteins, while normal, were at levels lower than found in wild-type cells. Thus, in the absence of the Orc1p BAH domain, HML resembled silencing of genes adjacent to telomeres. These data are consistent with the view that the Orc1p-Sir1p interaction at the E silencers ensures stable inheritance of pre-established Sir2p, Sir3p and Sir4p complexes at the silent mating type loci.


Figures

None
Fig. 1. The structure of the N-terminal domain of Orc1p. (A) Structure-guided sequence alignment of the N-terminal region of S.cerevisiae Orc1p (yOrc1) with the BAH domain-containing region of Sir3p (ySir3), human Orc1p (hOrc1), DNA-(cytosine-5)-methyltransferase 1 (Dnmt1), the human metastasis-associated protein 1 (Mta1) and S.cerevisiae Rsc1. The amino acids shown in white letters on a black background are invariant; white letters on a gray background indicate that similar amino acids are found in at least five proteins. Amino acids similar among yOrc1, ySir3 and hOrc1 are highlighted in cyan, and amino acids identical between yOrc1 and ySir3 are in blue rectangles. Green highlights the position of SIR3 mutants suppressing histone H4 and Rap1 mutations (Johnson et al., 1990; Liu and Lustig, 1996). Residues highlighted in yellow and red are class I and class II Sir3p mutants, respectively, which enhance the sir1 mating-defective phenotype (Stone et al., 2000). Secondary structural elements are colored as in (C) and shown above the sequences. Every 10 aa are indicated with a + sign. Residues shown in red were removed in the orc1m1 and orc1m2 mutants of yOrc1. In the orc1m1 mutant, the amino acids shown in red were replaced by the amino acids from hOrc1, also shown in red. (B) The crystal structure is shown in a ribbon representation. (C) Topology diagram showing the fold of the structure. The core of the structure consists mainly of β-strands and is colored cyan. The H domain is shown in magenta, and N- and C-terminal helices are shown in red. β-strands are numbered consecutively and α-helices are labeled alphabetically from the N- to the C-terminus.
None
Fig. 2. Mutations at the N-terminus of Orc1p decreased HMR and HML repression. (A) A schematic representation of mating type loci of yeast strains used for the silencing assays. (B) A qualitative colony color assay for silencing of the ADE2 gene at the HMR locus. Wild-type ORC1 (WT) or orc1 mutants, orc1m1 (m1), orc1m2 (m2) and orc1Δn (Δn) or sir1 mutant (sir1Δ) cells were assayed for repression of the ADE2 gene. (C) A FACS analysis of yeast cells before and after α-factor confrontation assay. Fractions of yeast cells at early logarithmic phase were either collected for FACS analysis (upper panels, –) or incubated with 10 µg/ml α-factor for 3 h before harvesting for FACS analysis (lower panels, +). The genotype of each strain was the same as in (B). 1C and 2C refer to the DNA content of yeast cells. (D) Images of cells after α-factor confrontation. Cells were counted under the microscope and the percentage of shmoo-cells from one representative experiment is shown.
None
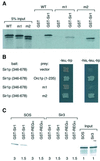
Fig. 3. Mutations in the BAH domain of Orc1p reduce its affinity to Sir1p. (A) The orc1m1 mutant reduced its affinity for Sir1p in vitro. Equal amounts of GST, or GST–Sir1 (346–678) proteins were used to pull down in vitro translated [35S]methionine-labeled Orc1p N-terminus (WT), or two mutants with mutations at the Orc1p N-terminus (m1 and m2). The proteins were resolved on an SDS–polyacrylamide gel and visualized by autoradiography. (B) Interactions between Sir1p and Orc1 or mutants determined by the yeast two-hybrid interaction system. After transforming a yeast strain (AH106) with relevant plasmids, yeast cells were patched onto yeast synthetic complete media lacking leucine and tryptophan for selection of plasmids, or media lacking histidine, leucine and tryptophan to test interactions. (C) GST–Sir1p interacted with an SOS (Sir3-Orc1 H domain Swap) mutant. GST–Sir1 or GST–REGα was used to pull down in vitro translated [35S]methionine-labeled Sir3p or SOS mutant. The number below indicates the relative amounts of in vitro translated proteins used to perform the binding assay.
None
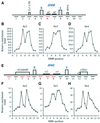
Fig. 4. Localization of Sir1p in WT ORC1 or orc1 mutant cells at the HM loci. (A) A schematic representation of the HMR locus with an integrated ADE2 gene. E and I silencers are represented by rectangles and the approximate position of the DNA fragment amplified by each PCR primer set is labeled with a number. A Ty1 LTR at position 3 and a tRNA gene located at site 9 are represented by rectangles. (B) An example of polyacrylamide gel analysis of PCR products. Multiplex PCR using primer sets shown in (A) and a primer set against a GAL1 fragment was performed in the presence of [32P]dATP using DNA from a Sir1p immunoprecipitation (ChIP, upper panel) or whole cell extract (WCE). (C) Localization of Sir1p at the HMR locus in wild-type ORC1 (WT, squares), orc1 mutants orc1m2 (m2, diamonds), orc1Δn (Δn, circles) and orc1m1 (m1, triangles), and sir1 (sir1Δ, filled squares) cells. The relative enrichment of each HMR fragment by Sir1p ChIP is plotted against the position of the PCR primer pair. (D) A schematic representation of the HML locus. Two silencers, E and I, are represented by rectangles and the two silenced genes α1 and α2 are also shown. The relative location of the CHA1 gene and an open reading frame YCL069W is shown. The approximate location of each DNA fragment amplified by each PCR primer is represented by a number and red lines represent non-unique primer sets. (E) An example of PCR fragments from multiplex PCR using DNA from Sir1p ChIP or WCE resolved on polyacrylamide gels. (F) Location of Sir1p at the HML locus in wild-type ORC1 or orc1 mutants. The relative enrichment (y-axis) of each HML DNA fragment from the Sir1p ChIP is plotted against primer location. All the strains except sir1 mutant strain contained Sir1-3HA.
None
Fig. 5. Localization of Sir2p, Sir3p and Sir4p proteins at the HMR and HML loci. (A) A schematic representation of the wild-type HMR locus. The relevant information is labeled as in Figure 4A. (B–D) Localization of Sir2p (B), Sir3p (C) and Sir4p (D) at the HMR silent chromatin domain. The relative enrichment of each DNA fragment at the HMR locus shown in (A) from each SIR ChIP is plotted against primer pair location. (E) A schematic representation of the HML locus as described in Figure 4D. (F–G) Localization of Sir2p (F), Sir3p (G) and Sir4p (H) at the HML locus. The relative enrichment of each HML fragment shown in (A) by each Sir ChIP is plotted against primer pair location.
None
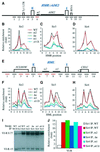
Fig. 6. Effect of orc1 and sir1 mutations on the localization of Sir2p, Sir3p and Sir4p at the HM loci. (A) A schematic representation of the altered HMR locus as described in Figure 4A. (B–D) Localization of Sir2p (B), Sir3p (C) and Sir4p (D) at the HMR chromatin domain in ORC1 (WT, squares), orc1m2 (m2, diamonds), orc1Δn (Δn, circles), orc1m1 (m1, triangles) and sir1 (sir1Δ, filled squares) cells. (E) A schematic representation of the HML locus as described in Figure 4D. (FH) localization of Sir2p (F), Sir3p (G) and Sir4p (H) at the HML chromatin domain in ORC1 (WT, squares), orc1m2 (m2, diamonds), orc1Δn (Δn, circles), orc1m1 (m1, triangles) and sir1 (sir1Δ, filled squares) cells. (I) Localization of Sir4p at the right end of chromosome VI (VI-R) in wild-type ORC1 or ORC1 mutants (m1, m2, Δn) or sir1Δ. The precipitated DNA or DNA from WCE was analyzed by multiplex PCR using one primer set located at 0.77 kb (VI-R 0.77) away from the right end of the telomere and another 15 kb (VI-R 15) away. (J) Relative enrichment of Sir1p and Sir4p localization at the telomere VI-R in ORC1 WT (WT) or orc1 mutant cells (m1, m2 and Δn) or sir1Δ cells.
None
Fig. 7. Grasp surface representation of the structure. (A) The location of Sir3p mutants mapped onto the Orc1pN235 structure (with the Orc1p amino acids labeled). As in Figure 1A, green indicates the position of mutants that suppress histone H4 mutations. Red indicates class II and yellow indicates class I sir3 mutants that enhance the sir1mutant defect (Stone et al., 2000). (B) Electrostatic potential distribution on the Orc1pN235 surface. Red indicates negative (–15 KBT), white indicates neutral (0 KBT) and blue indicates positive (+15 K KBT) charges, where KB is the Boltzmann constant and T is the temperature.

Similar articles

Cited by

References

    1. Bell S.P. and Stillman,B. (1992) ATP-dependent recognition of eukaryotic origins of DNA replication by a multiprotein complex. Nature, 357, 128–134. - PubMed
    1. Bell S.P., Kobayashi,R. and Stillman,B. (1993) Yeast origin recognition complex functions in transcription silencing and DNA replication. Science, 262, 1844–1849. - PubMed
    1. Bell S.P., Mitchell,J., Leber,J., Kobayashi,R. and Stillman,B. (1995) The multidomain structure of Orc1p reveals similarity to regulators of DNA replication and transcriptional silencing. Cell, 83, 563–568. - PubMed
    1. Bi X., Braunstein,M., Shei,G.J. and Broach,J.R. (1999) The yeast HML I silencer defines a heterochromatin domain boundary by directional establishment of silencing. Proc. Natl Acad. Sci. USA, 96, 11934–11939. - PMC - PubMed
    1. Buchman A.R., Lue,N.F. and Kornberg,R.D. (1988) Connections between transcriptional activators, silencers, and telomeres as revealed by functional analysis of a yeast DNA-binding protein. Mol. Cell. Biol., 8, 5086–5099. - PMC - PubMed

Publication types

MeSH terms

Associated data