Comparative Study
. 2002 Sep 17;99(19):12391-6.
doi: 10.1073/pnas.182380799. Epub 2002 Aug 28.

Complete genome sequence and comparative genomic analysis of an emerging human pathogen, serotype V Streptococcus agalactiae

Affiliations
Comparative Study

Complete genome sequence and comparative genomic analysis of an emerging human pathogen, serotype V Streptococcus agalactiae

Herve Tettelin et al. Proc Natl Acad Sci U S A. .

Abstract

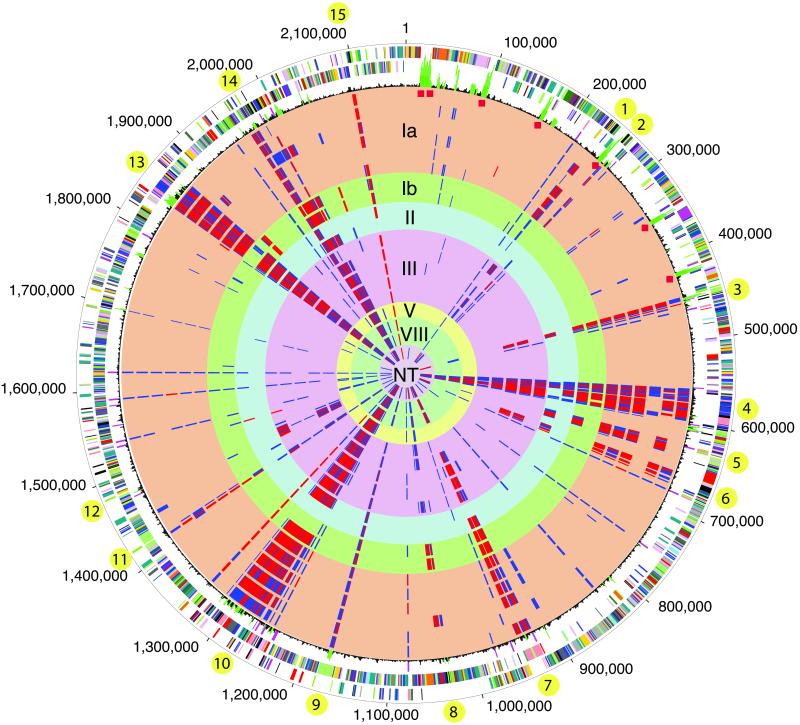
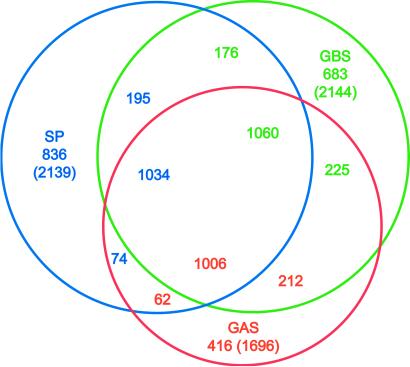
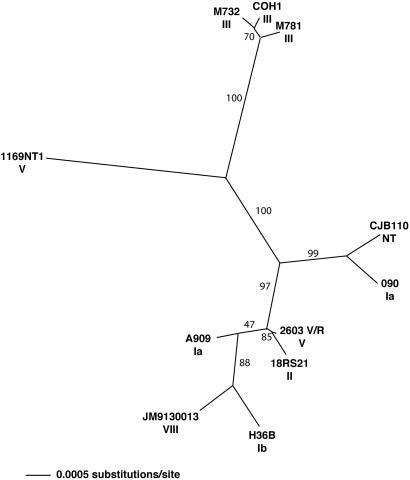
The 2,160,267 bp genome sequence of Streptococcus agalactiae, the leading cause of bacterial sepsis, pneumonia, and meningitis in neonates in the U.S. and Europe, is predicted to encode 2,175 genes. Genome comparisons among S. agalactiae, Streptococcus pneumoniae, Streptococcus pyogenes, and the other completely sequenced genomes identified genes specific to the streptococci and to S. agalactiae. These in silico analyses, combined with comparative genome hybridization experiments between the sequenced serotype V strain 2603 V/R and 19 S. agalactiae strains from several serotypes using whole-genome microarrays, revealed the genetic heterogeneity among S. agalactiae strains, even of the same serotype, and provided insights into the evolution of virulence mechanisms.


Figures

Fig 1.
Fig 1.
Circular representation of the S. agalactiae genome and comparative genome hybridizations using microarrays. Outer circle: predicted coding regions on the plus strand color coded by role categories: violet, amino acid biosynthesis; light blue, biosynthesis of cofactors, prosthetic groups, and carriers; light green, cell envelope; red, cellular processes; brown, central intermediary metabolism; yellow, DNA metabolism; light gray, energy metabolism; magenta, fatty acid and phospholipid metabolism; pink, protein synthesis and fate; orange, purines, pyrimidines, nucleosides, and nucleotides; olive, regulatory functions and signal transduction; dark green, transcription; teal, transport and binding proteins; gray, unknown function; salmon, other categories; blue, hypothetical proteins. Second circle: predicted coding regions on the minus strand. Third circle: black, atypical nucleotide composition curve; green, most atypical regions; magenta, insertion elements; red diamonds indicate rRNAs. Circles 4–22: comparative genome hybridizations of strain 2603 V/R with 19 S. agalactiae strains. Cy3/Cy5 (2603 V/R signal/test strain) ratio cutoffs were defined arbitrarily as Cy3/Cy5 = 1.0–3.0, gene present in test strain (not displayed); 3.0–10.0, ambiguous result (blue); >10.0, gene absent in test strain (red). Circles 4–9: type Ia strains 090, 515, A909, Davis, DK1, DK8; 10–11: type Ib (S7) 7357b and H36B; 12–13: type II 18RS21 and DK21; 14–18: type III COH1, COH31, D136C, M732 and M781; 19: type V strain CJB111; 20–21: type VIII strains SMU014 and JM9130013; 22: nontypable (NT) strain CJB110. Varying regions of five or more consecutive genes are indicated by yellow bullets.
Fig 2.
Fig 2.
In silico comparisons between streptococci. The protein sets of S. agalactiae [group B Streptococcus (GBS)], S. pneumoniae (SP), and S. pyogenes [group A Streptococcus (GAS)] were compared by using FASTA3. Numbers under the species name indicate genes that are not shared with the other species; values in parentheses are the number of proteins in each species (excluding frame-shifted and degenerated genes). Numbers in the intersections indicate genes shared by two or three species. These are displayed in the color corresponding to the species used as the query (GBS, green; SP, blue; GAS, red). Numbers in any given intersection are slightly different due to gene duplications in some species.
Fig 3.
Fig 3.
Phylogenetic tree of S. agalactiae strains based on PCR sequences. The sequences of 19 genes (Table 7) from each of 11 S. agalactiae strains were aligned and trimmed to remove ambiguously aligned regions, and phylogenetic trees were inferred. Strain names are indicated in bold, and serotypes are indicated under the strain names. Bootstrap values are indicated on the branches.

Similar articles

Cited by

References

    1. Zangwill K. M., Schuchat, A. & Wenger, J. D. (1992) Mor. Mortal Wkly. Rep. CDC Surveill. Summ. 41, 25-32. - PubMed
    1. Schuchat A. & Wenger, J. D. (1994) Epidemiol. Rev. 16, 374-402. - PubMed
    1. Anonymous (1996) MMWR Recomm. Rep. 45, 1-24. - PubMed
    1. Harrison L. H., Elliott, J. A., Dwyer, D. M., Libonati, J. P., Ferrieri, P., Billmann, L. & Schuchat, A. (1998) J. Infect. Dis. 177, 998-1002. - PubMed
    1. Lin F. Y., Clemens, J. D., Azimi, P. H., Regan, J. A., Weisman, L. E., Philips, J. B., III, Rhoads, G. G., Clark, P., Brenner, R. A. & Ferrieri, P. (1998) J. Infect. Dis. 177, 790-792. - PubMed

Publication types

Associated data

LinkOut - more resources