

Computational method for reducing variance with Affymetrix microarrays
- PMID: 12204100
- PMCID: PMC126253
- DOI: 10.1186/1471-2105-3-23
Computational method for reducing variance with Affymetrix microarrays
Abstract
Background: Affymetrix microarrays are used by many laboratories to generate gene expression profiles. Generally, only large differences (> 1.7-fold) between conditions have been reported. Computational methods to reduce inter-array variability might be of value when attempting to detect smaller differences. We examined whether inter-array variability could be reduced by using data based on the Affymetrix algorithm for pairwise comparisons between arrays (ratio method) rather than data based on the algorithm for analysis of individual arrays (signal method). Six HG-U95A arrays that probed mRNA from young (21-31 yr old) human muscle were compared with six arrays that probed mRNA from older (62-77 yr old) muscle.
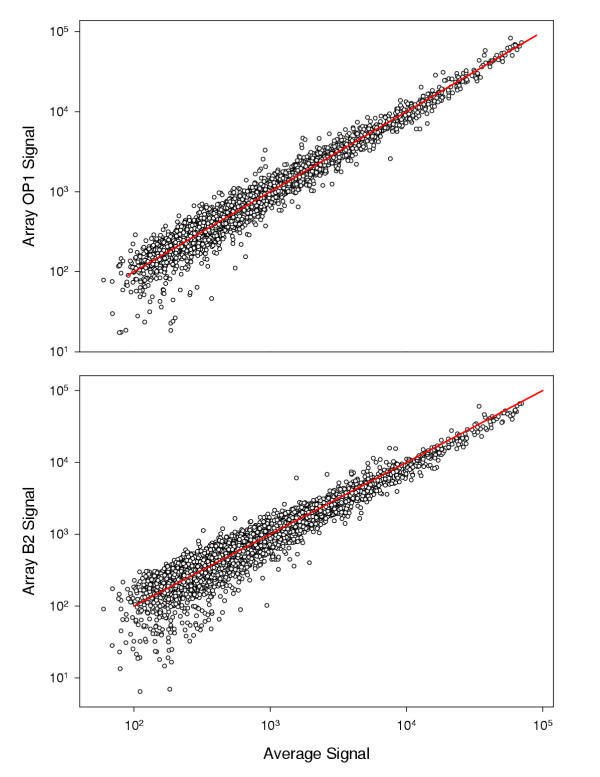
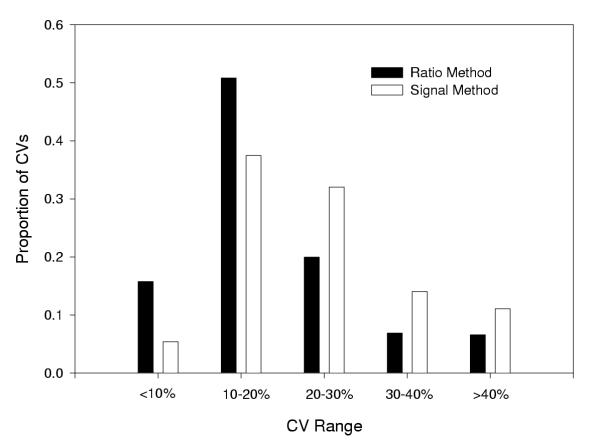
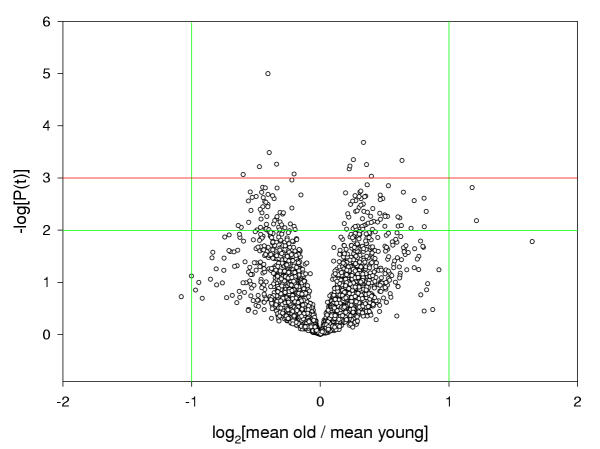
Results: Differences in mean expression levels of young and old subjects were small, rarely > 1.5-fold. The mean within-group coefficient of variation for 4629 mRNAs expressed in muscle was 20% according to the ratio method and 25% according to the signal method. The ratio method yielded more differences according to t-tests (124 vs. 98 differences at P < 0.01), rank sum tests (107 vs. 85 differences at P < 0.01), and the Significance Analysis of Microarrays method (124 vs. 56 differences with false detection rate < 20%; 20 vs. 0 differences with false detection rate < 5%). The ratio method also improved consistency between results of the initial scan and results of the antibody-enhanced scan.
Conclusion: The ratio method reduces inter-array variance and thereby enhances statistical power.
Figures

Similar articles
-
Reproducibility of gene expression across generations of Affymetrix microarrays.BMC Bioinformatics. 2003 Jun 25;4:27. doi: 10.1186/1471-2105-4-27. Epub 2003 Jun 25. BMC Bioinformatics. 2003. PMID: 12823866 Free PMC article.
-
Sources of variability and effect of experimental approach on expression profiling data interpretation.BMC Bioinformatics. 2002;3:4. doi: 10.1186/1471-2105-3-4. Epub 2002 Jan 31. BMC Bioinformatics. 2002. PMID: 11936955 Free PMC article.
-
Match-only integral distribution (MOID) algorithm for high-density oligonucleotide array analysis.BMC Bioinformatics. 2002;3:3. doi: 10.1186/1471-2105-3-3. Epub 2002 Jan 22. BMC Bioinformatics. 2002. PMID: 11835687 Free PMC article.
-
Microarray data quality control improves the detection of differentially expressed genes.Genomics. 2010 Mar;95(3):138-42. doi: 10.1016/j.ygeno.2010.01.003. Epub 2010 Jan 14. Genomics. 2010. PMID: 20079422 Review.
-
What statisticians should know about microarray gene expression technology.Methods Mol Biol. 2013;972:1-13. doi: 10.1007/978-1-60327-337-4_1. Methods Mol Biol. 2013. PMID: 23385528 Review.
Cited by
-
Machine Learning on Human Muscle Transcriptomic Data for Biomarker Discovery and Tissue-Specific Drug Target Identification.Front Genet. 2018 Jul 12;9:242. doi: 10.3389/fgene.2018.00242. eCollection 2018. Front Genet. 2018. PMID: 30050560 Free PMC article.
-
Genomic data sampling and its effect on classification performance assessment.BMC Bioinformatics. 2003 Jan 28;4:5. doi: 10.1186/1471-2105-4-5. Epub 2003 Jan 28. BMC Bioinformatics. 2003. PMID: 12553886 Free PMC article.
-
Comparative Meta-Analysis of Transcriptomics Data during Cellular Senescence and In Vivo Tissue Ageing.Oxid Med Cell Longev. 2015;2015:732914. doi: 10.1155/2015/732914. Epub 2015 Apr 21. Oxid Med Cell Longev. 2015. PMID: 25977747 Free PMC article.
-
Comparative analysis of the Arabidopsis pollen transcriptome.Plant Physiol. 2003 Jun;132(2):640-52. doi: 10.1104/pp.103.020925. Plant Physiol. 2003. PMID: 12805594 Free PMC article.
-
Oligonucleotide Microarrays Identified Potential Regulatory Genes Related to Early Outward Arterial Remodeling Induced by Tissue Plasminogen Activator.Front Physiol. 2019 Apr 30;10:493. doi: 10.3389/fphys.2019.00493. eCollection 2019. Front Physiol. 2019. PMID: 31114508 Free PMC article.
References
Publication types
MeSH terms
Substances
Grants and funding
LinkOut - more resources
Full Text Sources
Other Literature Sources
Molecular Biology Databases
