

Brainstem modulation of visual response properties of single cells in the dorsal lateral geniculate nucleus of cat
- PMID: 12205188
- PMCID: PMC2290523
- DOI: 10.1113/jphysiol.2002.021204
Brainstem modulation of visual response properties of single cells in the dorsal lateral geniculate nucleus of cat
Abstract
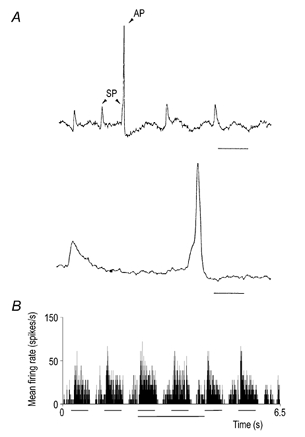
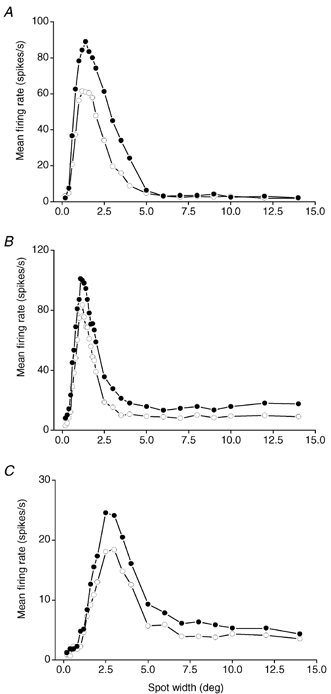
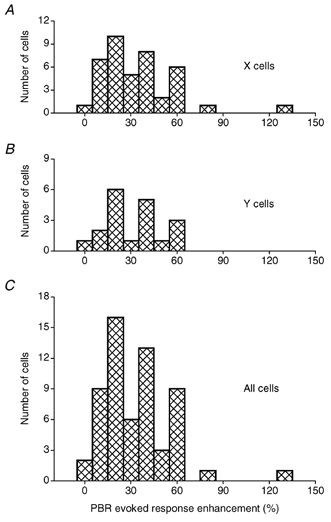
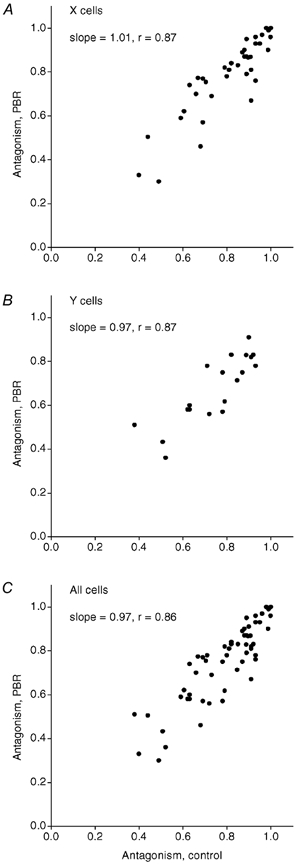
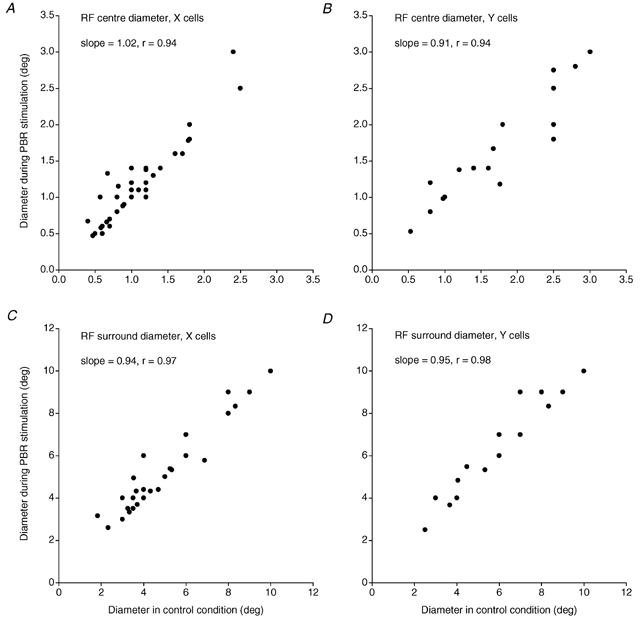
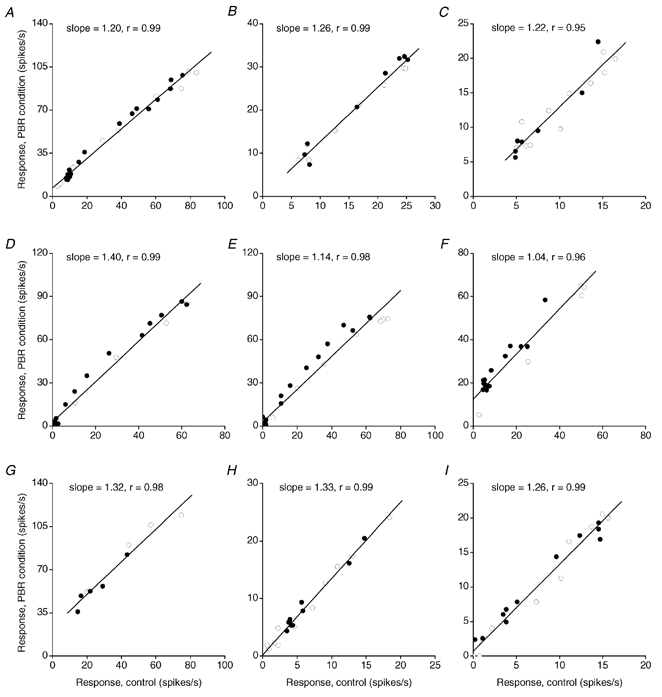
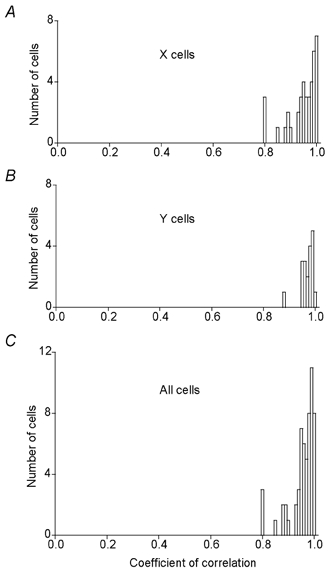
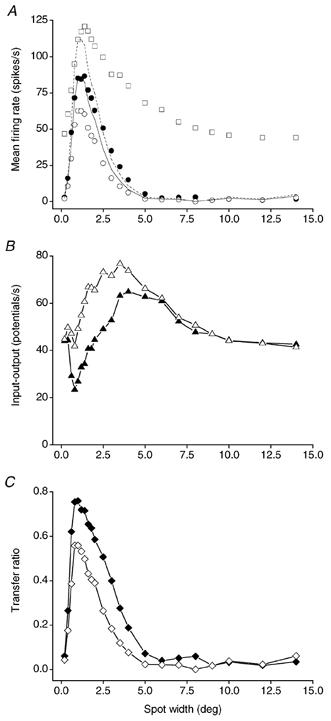
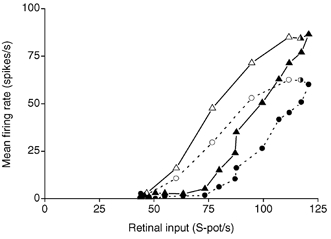
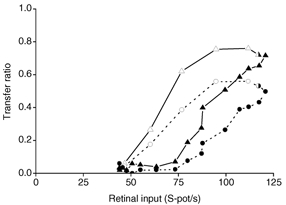
The dorsal lateral geniculate nucleus (dLGN) transmits visual signals from the retina to the cortex. In the dLGN the antagonism between the centre and the surround of the receptive fields is increased through intrageniculate inhibitory mechanisms. Furthermore, the transmission of signals through the dLGN is modulated in a state-dependent manner by input from various brainstem nuclei including an area in the parabrachial region (PBR) containing cholinergic cells involved in the regulation of arousal and sleep. Here, we studied the effects of increased PBR input on the spatial receptive field properties of cells in the dLGN. We made simultaneous single-unit recordings of the input to the cells from the retina (S-potentials) and the output of the cells to the cortex (action potentials) to determine spatial receptive field modifications generated in the dLGN. State-dependent modulation of the spatial receptive field properties was studied by electrical stimulation of the PBR. The results showed that PBR stimulation had only a minor effect on the modifications of the spatial receptive field properties generated in the dLGN. The PBR-evoked effects could be described mainly as increased response gain. This suggested that the spatial modifications of the receptive field occurred at an earlier stage of processing in the dLGN than the PBR-controlled gain regulation, such that the PBR input modulates the gain of the spatially modified signals. We propose that the spatial receptive field modifications occur at the input to relay cells through the synaptic triades between retinal afferents, inhibitory interneurone dendrites, and relay cell dendrites and that the gain regulation is related to postsynaptic cholinergic effects on the relay cells.
Figures
Similar articles
-
Brain stem modulation of spatial receptive field properties of single cells in the dorsal lateral geniculate nucleus of the cat.J Neurophysiol. 1993 Oct;70(4):1644-55. doi: 10.1152/jn.1993.70.4.1644. J Neurophysiol. 1993. PMID: 8283220
-
Spatial summation and center-surround antagonism in the receptive field of single units in the dorsal lateral geniculate nucleus of cat: comparison with retinal input.Vis Neurosci. 2000 Nov-Dec;17(6):855-70. doi: 10.1017/s0952523800176059. Vis Neurosci. 2000. PMID: 11193102
-
Response variability of single cells in the dorsal lateral geniculate nucleus of the cat. Comparison with retinal input and effect of brain stem stimulation.J Neurophysiol. 1994 Sep;72(3):1278-89. doi: 10.1152/jn.1994.72.3.1278. J Neurophysiol. 1994. PMID: 7807211
-
The control of retinogeniculate transmission in the mammalian lateral geniculate nucleus.Exp Brain Res. 1986;63(1):1-20. doi: 10.1007/BF00235642. Exp Brain Res. 1986. PMID: 3015651 Review.
-
The modulation of the retinal relay to the cortex in the dorsal lateral geniculate nucleus.Eye (Lond). 1988;2 Suppl:S221-32. doi: 10.1038/eye.1988.146. Eye (Lond). 1988. PMID: 3076150 Review.
Cited by
-
Acetylcholine dynamically controls spatial integration in marmoset primary visual cortex.J Neurophysiol. 2005 Apr;93(4):2062-72. doi: 10.1152/jn.00911.2004. Epub 2004 Nov 17. J Neurophysiol. 2005. PMID: 15548624 Free PMC article.
-
Frequency-dependent modulation of retinogeniculate transmission by serotonin.J Neurosci. 2004 Dec 1;24(48):10950-62. doi: 10.1523/JNEUROSCI.3749-04.2004. J Neurosci. 2004. PMID: 15574745 Free PMC article.
-
Coarse-to-fine changes of receptive fields in lateral geniculate nucleus have a transient and a sustained component that depend on distinct mechanisms.PLoS One. 2011;6(9):e24523. doi: 10.1371/journal.pone.0024523. Epub 2011 Sep 9. PLoS One. 2011. PMID: 21931739 Free PMC article.
-
Visual response properties in the dorsal lateral geniculate nucleus of mice lacking the beta2 subunit of the nicotinic acetylcholine receptor.J Neurosci. 2004 Sep 29;24(39):8459-69. doi: 10.1523/JNEUROSCI.1527-04.2004. J Neurosci. 2004. PMID: 15456819 Free PMC article.
-
Cholinergic activation of M2 receptors leads to context-dependent modulation of feedforward inhibition in the visual thalamus.PLoS Biol. 2010 Apr 6;8(4):e1000348. doi: 10.1371/journal.pbio.1000348. PLoS Biol. 2010. PMID: 20386723 Free PMC article.
References
-
- Ahlsén G, Lindström S, Lo F-S. Interaction between inhibitory pathways to principal cells in the lateral geniculate nucleus of the cat. Experimental Brain Research. 1985;58:134–143. - PubMed
-
- Bishop PO, Burke W, Davis R. Synapse discharge by single fibre in mammalian visual system. Nature. 1958;182:728–730. - PubMed
-
- Bullier J, Norton TT. X and Y relay cells in cat lateral geniculate nucleus: Quantitative analysis of receptive-field properties and classification. Journal of Neurophysiology. 1979;42:244–273. - PubMed
-
- Cheng H, Chino YM, Smith I EL, II, Hamamoto J, Yoshida K. Transfer characteristics of lateral geniculate nucleus X neurons in the cat: Effects of spatial frequency and contrast. Journal of Neurophysiology. 1995;74:2548–2557. - PubMed
Publication types
MeSH terms
LinkOut - more resources
Full Text Sources
Miscellaneous