

Disruption of the two-state membrane potential of striatal neurones during cortical desynchronisation in anaesthetised rats
- PMID: 12205191
- PMCID: PMC2290508
- DOI: 10.1113/jphysiol.2002.0024786
Disruption of the two-state membrane potential of striatal neurones during cortical desynchronisation in anaesthetised rats
Abstract
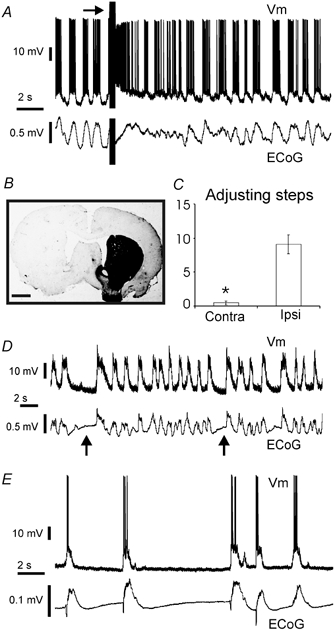
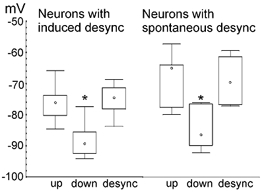
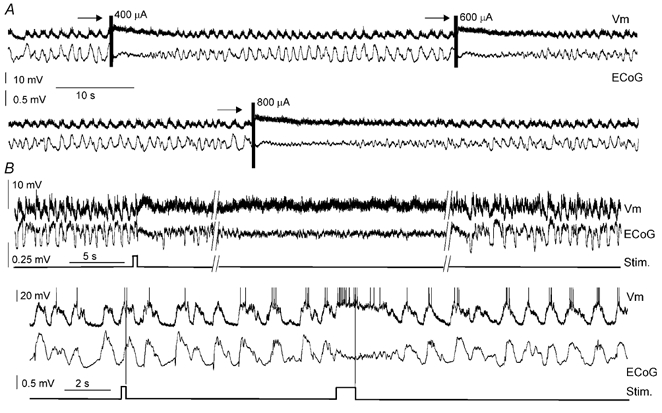
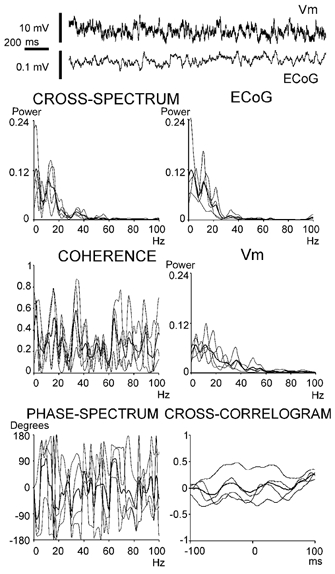
In anaesthetised animals, the very negative resting membrane potential of striatal spiny neurones (down state) is interrupted periodically by depolarising plateaux (up states) which are probably driven by excitatory input. In the absence of active synaptic input, as occurs in vitro, potassium currents hold the membrane potential of striatal spiny neurones in the down state. Because striatal spiny neurones fire action potentials only during the up state, these plateau depolarisations have been perceived as enabling events that allow information processing through cerebral cortex-basal ganglia circuits. Recent studies have demonstrated that the robust membrane potential fluctuation of spiny neurones is strongly correlated to the slow electroencephalographic rhythms that are typical of slow wave sleep and anaesthesia. To further understand the impact of cortical activity states on striatal function, we studied the membrane potential of striatal neurones during cortical desynchronised states. Simultaneous in vivo recordings of striatal neurones and the electrocorticogram in urethane-anaesthetised rats revealed that rhythmic alternation between up and down states was disrupted during episodes of spontaneous or induced cortical desynchronisation. Instead of showing robust two-state fluctuations, the membrane potential of striatal neurones displayed a persisting depolarised state with fast, low-amplitude modulations. Spiny neurones remained in this persistent up state until the cortex resumed ~1 Hz synchronous activity. Most of the recorded neurones exhibited a low firing probability, irrespective of the cortical activity state. Time series analysis failed to reveal significant correlations between the membrane potential of striatal neurones and the desynchronised electrocorticogram. Our results suggest that during cortical desynchronisation continuous uncorrelated excitatory input sustains the membrane potential of striatal neurones in a persisting depolarised state, but that substantial additional input is necessary to impel the neurones to threshold. Our data support that the prevailing cortical activity state determines the duration of the enabling depolarising events that take place in striatal spiny neurones.
Figures
Similar articles
-
Cortical slow oscillatory activity is reflected in the membrane potential and spike trains of striatal neurons in rats with chronic nigrostriatal lesions.J Neurosci. 2001 Aug 15;21(16):6430-9. doi: 10.1523/JNEUROSCI.21-16-06430.2001. J Neurosci. 2001. PMID: 11487667 Free PMC article.
-
Quantitative estimate of synaptic inputs to striatal neurons during up and down states in vitro.J Neurosci. 2003 Oct 8;23(27):9123-32. doi: 10.1523/JNEUROSCI.23-27-09123.2003. J Neurosci. 2003. PMID: 14534246 Free PMC article.
-
Relationship between EEG potentials and intracellular activity of striatal and cortico-striatal neurons: an in vivo study under different anesthetics.Cereb Cortex. 2001 Apr;11(4):360-73. doi: 10.1093/cercor/11.4.360. Cereb Cortex. 2001. PMID: 11278199
-
Brain oscillations, medium spiny neurons, and dopamine.Cell Mol Neurobiol. 2002 Dec;22(5-6):611-32. doi: 10.1023/a:1021840504342. Cell Mol Neurobiol. 2002. PMID: 12585682 Free PMC article. Review.
-
Various synaptic activities and firing patterns in cortico-striatal and striatal neurons in vivo.J Physiol Paris. 2003 Jul-Nov;97(4-6):557-66. doi: 10.1016/j.jphysparis.2004.01.013. J Physiol Paris. 2003. PMID: 15242665 Review.
Cited by
-
Feedforward inhibition of projection neurons by fast-spiking GABA interneurons in the rat striatum in vivo.J Neurosci. 2005 Apr 13;25(15):3857-69. doi: 10.1523/JNEUROSCI.5027-04.2005. J Neurosci. 2005. PMID: 15829638 Free PMC article.
-
NMDA receptor gating of information flow through the striatum in vivo.J Neurosci. 2008 Dec 10;28(50):13384-9. doi: 10.1523/JNEUROSCI.4343-08.2008. J Neurosci. 2008. PMID: 19074011 Free PMC article.
-
Origin and properties of striatal local field potential responses to cortical stimulation: temporal regulation by fast inhibitory connections.PLoS One. 2011;6(12):e28473. doi: 10.1371/journal.pone.0028473. Epub 2011 Dec 6. PLoS One. 2011. PMID: 22163020 Free PMC article.
-
Explicit-duration hidden Markov model inference of UP-DOWN states from continuous signals.PLoS One. 2011;6(6):e21606. doi: 10.1371/journal.pone.0021606. Epub 2011 Jun 28. PLoS One. 2011. PMID: 21738730 Free PMC article.
-
Medium spiny neurons activity reveals the discrete segregation of mouse dorsal striatum.Elife. 2021 Feb 18;10:e60580. doi: 10.7554/eLife.60580. Elife. 2021. PMID: 33599609 Free PMC article.
References
-
- Apicella P, Scarnati E, Ljungberg T, SchultZ W. Neuronal activity in monkey striatum related to the expectation of predictable environmental events. Journal of Neurophysiology. 1992;68:945–960. - PubMed
-
- Boussaoud D, Kermadi I. The primate striatum: neuronal activity in relation to spatial attention versus motor preparation. European Journal of Neuroscience. 1997;9:2152–2168. - PubMed
-
- Calabresi P, Mercuri NB, Stefani A, Bernardi G. Synaptic and intrinsic control of membrane excitability of neostriatal neurons. I. An in vivo analysis. Journal of Neurophysiology. 1990;63:651–662. - PubMed
-
- Contreras D, Steriade M. State-dependent fluctuations of low-frequency rhythms in corticothalamic networks. Neuroscience. 1997;76:25–38. - PubMed
-
- Cowan RL, Wilson CJ. Spontaneous firing patterns and axonal projections of single corticostriatal neurons in the rat medial agranular cortex. Journal of Neurophysiology. 1994;71:17–32. - PubMed
Publication types
MeSH terms
LinkOut - more resources
Full Text Sources
Other Literature Sources