. 2002 Sep 1;16(17):2286-99.
doi: 10.1101/gad.991102.

Interactions between Ras1, dMyc, and dPI3K signaling in the developing Drosophila wing

Affiliations

Interactions between Ras1, dMyc, and dPI3K signaling in the developing Drosophila wing

David A Prober et al. Genes Dev. .

Abstract

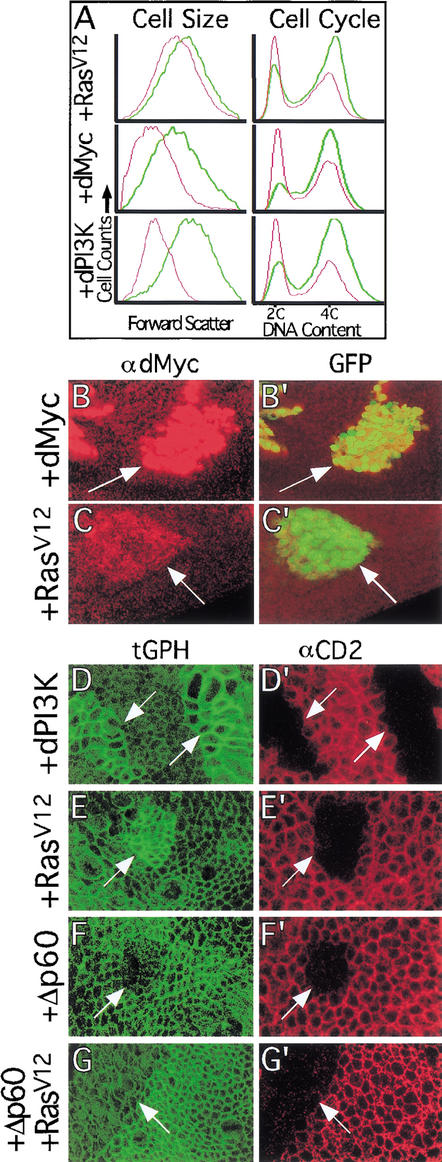
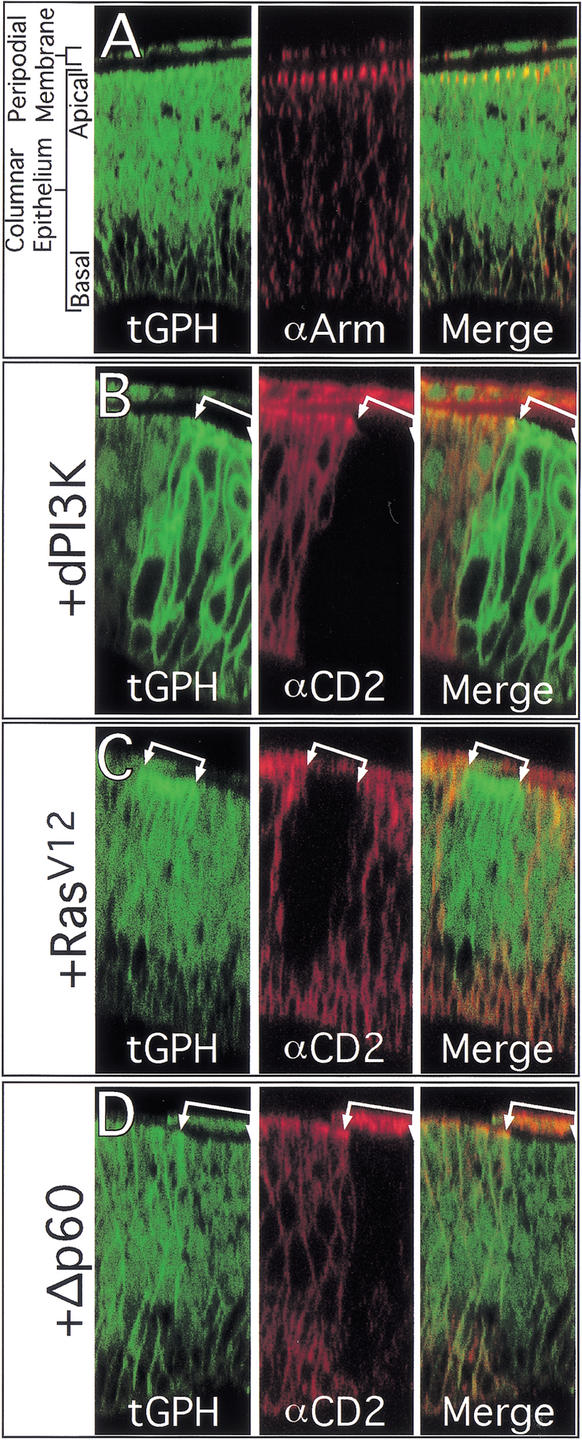
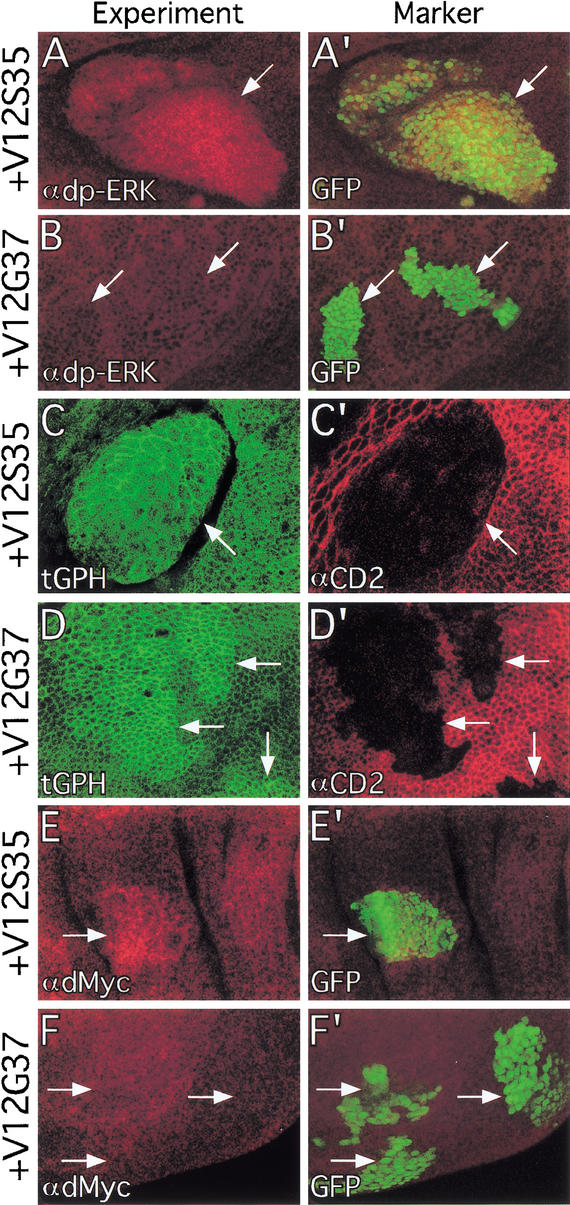
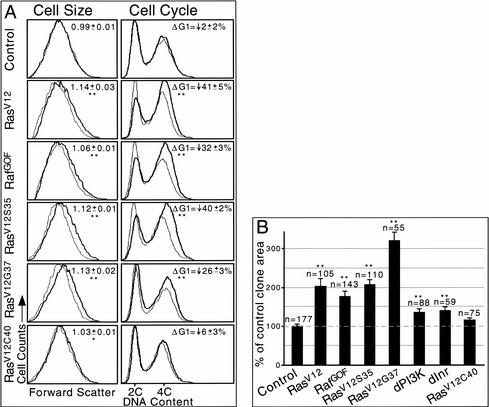
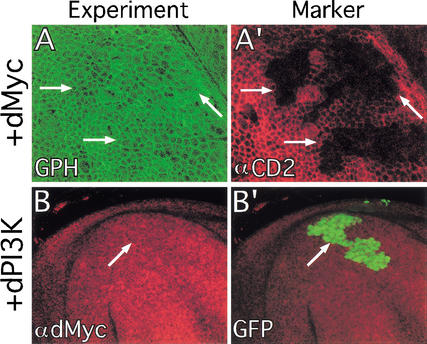
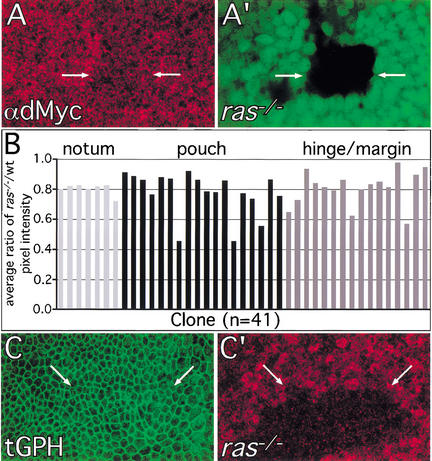
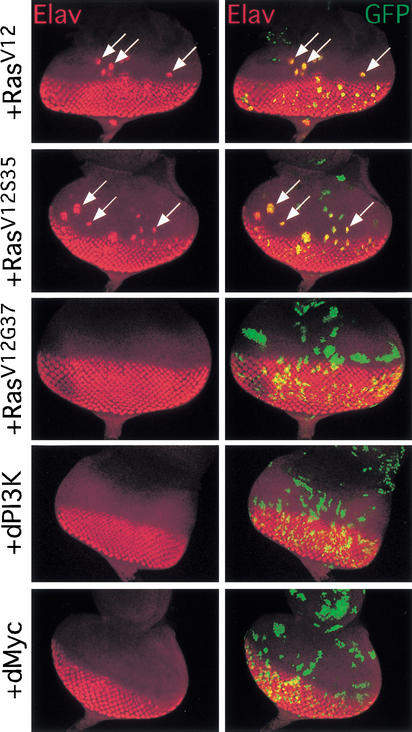
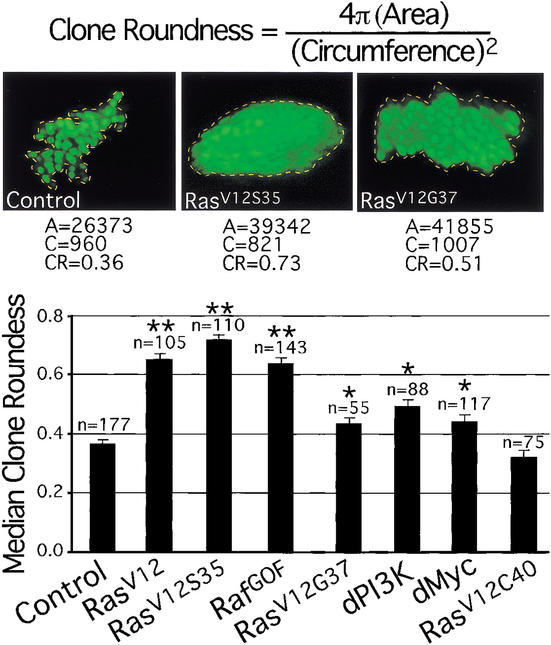
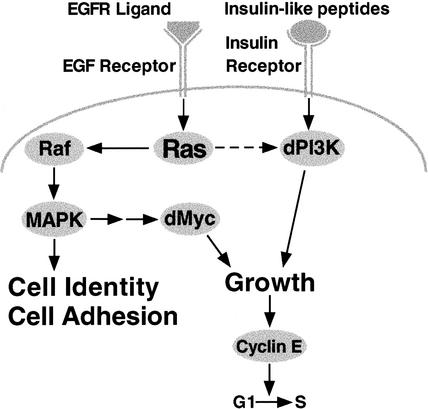
The Ras GTPase links extracellular signals to intracellular mechanisms that control cell growth, the cell cycle, and cell identity. An activated form of Drosophila Ras (Ras(V12)) promotes these processes in the developing wing, but the effector pathways involved are unclear. Here, we present evidence indicating that Ras(V12) promotes cell growth and G(1)/S progression by increasing dMyc protein levels and activating dPI3K signaling, and that it does so via separate effector pathways. We also show that endogenous Ras is required to maintain normal levels of dMyc, but not dPI3K signaling during wing development. Finally, we show that induction of dMyc and regulation of cell identity are separable effects of Raf/MAPK signaling. These results suggest that Ras may only affect PI3K signaling when mutationally activated, such as in Ras(V12)-transformed cells, and provide a basis for understanding the synergy between Ras and other growth-promoting oncogenes in cancer.


Figures

Figure 1
Figure 1
RasV12 expression increases dMyc protein levels and activates dPI3K signaling. (A) FACS analysis of wing disc cells overexpressing RasV12, dMyc, or dPI3K. Green and red traces represent GFP+ (experimental) and GFP (control) cells, respectively. Each trace is normalized to fit the graph as the numbers of GFP+ and GFP cells analyzed for each sample were not exactly equal. (Left) Cell size. Forward scatter data, which gives a relative measure of cell size, shows that expression of RasV12, dMyc, or dPI3K increases cell size. (Right) Cell cycle. DNA content data, which shows the proportion of cells in G1 (2C) and G2 (4C), indicates that expression of RasV12, dMyc, or dPI3K decreases the proportion of cells in G1. (B,C) Flp/Gal4 clones (marked with GFP in B‘ and C‘) expressing either dMyc (B,B‘) or RasV12 (C,C‘) show increased staining with a dMyc-specific antibody (B,C). (D–G) Flp/Gal4 clones (marked by loss of the CD2 cell membrane marker in D′,E′,F‘,G‘) expressing either dPI3K (D) or RasV12 (E) have increased cell membrane-associated tGPH, a PH-GFP fusion protein used as an indicator of dPI3K signaling. In contrast, clones expressing either Δp60 (F) or Δp60+RasV12 (G) have reduced cell membrane-associated tGPH. Note that apical tGPH and lateral αCD2 sections are shown, resulting in slight misalignment of tGPH and αCD2 in these images. Magnification: B,C, 40×; D–G, 100×.
Figure 2
Figure 2
Subcellular localization of tGPH. (A) Optical cross-sections showing that tGPH is localized throughout the cell membranes, cytoplasm, and nuclei of cells in the columnar epithelium and peripodial membrane of imaginal wing discs. Intense GFP fluorescence is present at the apical region of the cell membrane, colocalizing with Armadillo, a component of apically localized adherens junctions. (B–D) Flp/Gal4 clones (marked by loss of CD2) overexpressing dPI3K have strong tGPH fluorescence throughout the entire cell membrane (B). Clones expressing RasV12 have increased tGPH fluorescence at the apical region of the cell membrane (C). Clones expressing Δp60 have reduced tGPH fluorescence throughout the cell membrane (D). Magnification, 100×.
Figure 3
Figure 3
Ras effector loop mutants activate different effector pathways. (A,B) Flp/Gal4 clones (marked with GFP in A‘,B‘) expressing RasV12S35 have increased dp-ERK staining (A), whereas clones expressing RasV12G37 do not (B). (C,D) Flp/Gal4 clones (marked by loss of CD2 in C‘,D‘) expressing RasV12G37 have increased membrane-associated tGPH (D), whereas clones expressing RasV12S35 do not (C). (E,F) Flp/Gal4 clones (marked with GFP in E‘,F‘) expressing RasV12S35 have increased dMyc protein levels (E), whereas clones expressing RasV12G37 do not (F). Magnification: A,B,E,F, 40×; C,D, 100×.
Figure 4
Figure 4
Ras effector loop mutants increase cell size, promote G1/S progression, and increase clonal growth. (A) Flow cytometry. Dark and light traces represent GFP+ (experimental) and GFP (control) cells, respectively. Each trace is normalized to fit the graph as the numbers of GFP+ and GFP cells analyzed for each sample were not exactly equal. Data shown are from an experimental set performed in parallel. Values significantly different from control are indicated (*, P < 0.05; **, P < 0.01). (Left) Cell size. Forward scatter data, which gives a relative measure of cell size, shows that expression of RasV12, RafGOF, RasV12S35, or RasV12G37 increases cell size. Numbers indicate the mean value of (GFP+ mean FSC)/(GFP mean FSC) ± standard error of the mean for six experiments (except for RafGOF, which was repeated four times). (Right) Cell cycle. DNA content data, which shows the proportion of cells in G1 (2C) and G2 (4C), indicates that expression of RasV12, RafGOF, RasV12S35, or RasV12G37 decreases the proportion of cells in G1. Numbers indicate the mean percentage change of GFP+ cells compared with GFP cells in the proportion of cells in G1 (ΔG1) ± standard error of the mean for six experiments (except for RafGOF, which was repeated four times). (B) Median areas of Flp/Gal4 clones expressing various transgenes are shown. Expression of any transgene except RasV12C40 significantly increased clone areas relative to control clones expressing GFP alone. Clones were induced at 48 h after egg deposition (AED; except for dInr, which was induced at 72 h AED) and analyzed at 120 h AED. n, number of clones measured. Error bars, standard error of the mean; **, P < 0.01 vs. control. Note that larvae overexpressing dPI3K or dInr under these conditions are developmentally delayed, and as a result the clone areas measured in this experiment underestimate dPI3K-and dInr-dependent clonal growth. Overexpression of dMyc also greatly increases clonal growth rates (Johnston et al. 1999).
Figure 5
Figure 5
Overexpressed dMyc and dPI3K do not affect each other. (A) Clones of cells overexpressing dMyc (marked by loss of CD2 in A‘) have normal tGPH localization. (B) Clones of cells overexpressing dPI3K (marked with GFP in B‘) have normal dMyc protein levels. Magnification: A, 100×; B 40×.
Figure 6
Figure 6
Endogenous Ras is required to maintain normal levels of dMyc protein but not dPI3K signaling. The FLP/FRT technique was used to generate ras−/− clones in ras+/− tissues. (A) ras−/− cells (marked by loss of GFP in A‘) have reduced levels of dMyc protein. Genotype: hs-FLP122; UAS-P35/en-Gal4; FRT (82B) rasc40b/FRT (82B) Ub-GFP. (B) Quantitation of dMyc antibody staining intensity in ras−/− clones compared with neighboring ras+/− and ras+/+ regions. Ratios of average pixel intensity ras−/−/average pixel intensity ras+/− or ras+/+ were calculated for individual clones. To minimize confounding bias due to patterned endogenous dMyc levels, each bar represents the average value of 10–15 ratios for a single clone (see Materials and Methods). Regions within ras−/− clones consistently had lower values than surrounding regions (average = 0.79 ± 0.02; P = 2 × 10−6 for 41 clones). dMyc antibody staining intensities in neighboring ras+/− and ras+/+ regions were not significantly different (average ratio of ras+/−/ras+/+ = 0.9 5 ± 0.05, P = 0.45 for 11 clones). ras−/− clones had similar effects on dMyc antibody staining intensities in regions of the wing with high (notum and pouch) and low (hinge/margin) endogenous dMyc levels. (C) ras−/− cells (marked by loss of the πmyc marker in C‘) have normal tGPH localization and intensity. Genotype: hs-FLP122; UAS-P35/tGPH; en– Gal4; FRT (82B) rasc40b/FRT (82B) hs-πmyc. Magnification: A,B, 100×.
Figure 7
Figure 7
Ras promotes precocious photoreceptor differentiation via Raf/MAPK signaling. Eye discs with Flp/Gal4 clones (marked with GFP at right) expressing various transgenes are shown. Expression of RasV12 or RasV12S35 induces precocious Elav staining (arrows), whereas expression of RasV12G37, dPI3K, or dMyc does not. Magnification, 20×.
Figure 8
Figure 8
Ras affects clone shape via the Raf/MAPK pathway. Median clone roundness values of Flp/Gal4 clones expressing various transgenes are shown. Expression of any transgene except RasV12C40 significantly increases clone roundness relative to control clones expressing GFP alone, although RasV12, RasV12S35, and RafGOF have significantly stronger effects than RasV12G37, dPI3K, and dMyc. Representative images and measurements are shown. Clones were induced at 48 h after egg deposition (AED) and analyzed at 120 h AED. A, clone area; C, clone circumference; CR, clone roundness; n, number of clones measured. Error bars: standard error of the mean; *, P < 0.001 vs. control; **, P ≪ 0.001 vs. control.
Figure 9
Figure 9
Model for interactions between Ras, dMyc, and dPI3K in the developing Drosophila wing. Ectopic expression of RasV12 drives cell growth via at least two genetically separable pathways. RasV12 activates Raf/MAPK signaling, which increases levels of dMyc protein. RasV12 also independently activates dPI3K signaling. The resulting increased rate of cell growth increases cyclin E protein levels, thereby promoting G1/S progression (Prober and Edgar 2000). Ras is normally activated by the binding of ligands to the EGF receptor, and is required to maintain normal levels of dMyc protein but not dPI3K signaling (dashed arrow). dPI3K is likely normally regulated by the binding of insulin-like peptides to the Insulin receptor. RasV12 also affects cell identity and adhesion via Raf/MAPK signaling. Arrows indicate genetic interactions and do not imply direct molecular interactions.

References

    1. Andersson S, Saeboe-Larssen S, Lambertsson A, Merriam J, Jacobs-Lorena M. A Drosophila third chromosome Minute locus encodes a ribosomal protein. Genetics. 1994;137:513–520. - PMC - PubMed
    1. Barbacid M. ras genes. Annu Rev Biochem. 1987;56:779–827. - PubMed
    1. Biggs WH, III, Zipursky SL. Primary structure, expression, and signal-dependent tyrosine phosphorylation of a Drosophila homolog of extracellular signal-regulated kinase. Proc Natl Acad Sci. 1992;89:6295–6299. - PMC - PubMed
    1. Boon K, Caron HN, van Asperen R, Valentijn L, Hermus MC, van Sluis P, Roobeek I, Weis I, Voute PA, Schwab M, et al. N-myc enhances the expression of a large set of genes functioning in ribosome biogenesis and protein synthesis. EMBO J. 2001;20:1383–1393. - PMC - PubMed
    1. Boriack-Sjodin PA, Margarit SM, Bar-Sagi D, Kuriyan J. The structural basis of the activation of Ras by Sos. Nature. 1998;394:337–343. - PubMed

Publication types

MeSH terms