. 2002 Sep 17;99(19):12138-42.
doi: 10.1073/pnas.192453199. Epub 2002 Sep 4.

The structural basis for the transition from Ras-GTP to Ras-GDP

Affiliations

The structural basis for the transition from Ras-GTP to Ras-GDP

Brian E Hall et al. Proc Natl Acad Sci U S A. .

Abstract

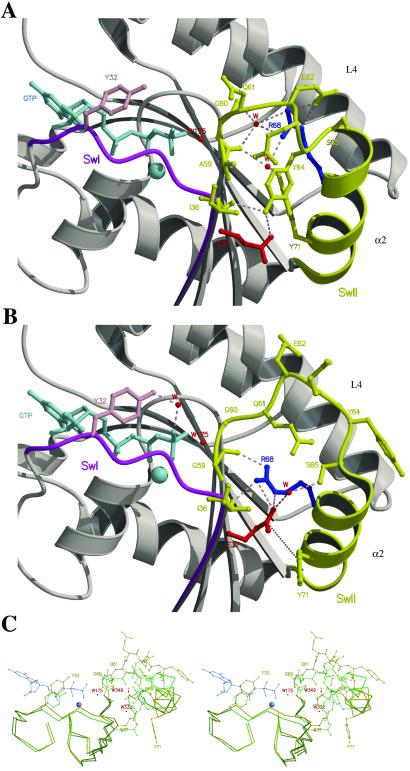
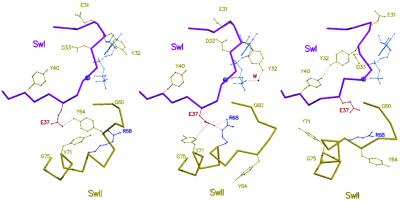
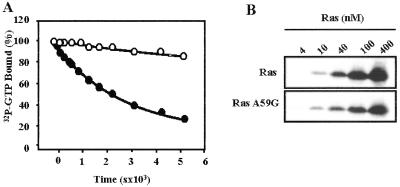
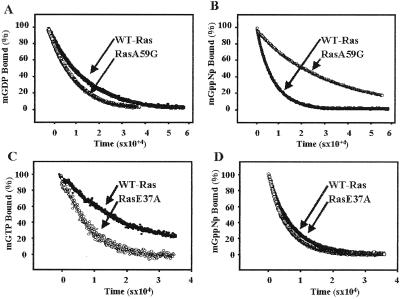
The conformational changes in Ras that accompany the hydrolysis of GTP are critical to its function as a molecular switch in signaling pathways. Understanding how GTP is hydrolyzed by revealing the sequence of intermediary structures in the reaction is essential for understanding Ras signaling. Until now, no structure of an intermediate in GTP hydrolysis has been experimentally determined for Ras alone. We have solved the crystal structure of the Ala-59 to Gly mutant of Ras, (RasA59G), bound to guanosine 5'-imidotriphosphate or GDP to 1.7-A resolution. In the guanosine 5'-imidotriphosphate-bound form, this mutant adopts a conformation that is intermediate between the GTP- and GDP-bound forms of wild-type Ras and that is similar to what has been predicted by molecular dynamics simulation [Ma, J. P. & Karplus, M. (1997) Proc. Natl. Acad. Sci. USA 94, 11905-11910]. This conformation is stabilized by direct and water-mediated interactions between the switch 1 and switch 2 regions and is characterized by an increase in the binding affinity for GTP. We propose that the structural changes promoted by the Ala-59 to Gly mutation exhibit a discrete conformational state assumed by wild-type Ras during GTP hydrolysis.


Figures

Fig 1.
Fig 1.
Structural changes induced in Ras switch regions by the glycine for alanine substitution at position 59. Close-up view of Glu-37 (switch 1) and Arg-68 (switch 2) in the crystal structures of wild-type Ras (A) (15) and RasA59G (B) in the GppNp-bound forms. Switch 1 (SwI) and switch 2 (SwII) are in magenta and yellow, respectively. Loop L4 and helix-α2 of switch 2 are labeled. The GppNp and the Mg2+-ion are in light blue, and water molecules (W) are represented by red spheres. Tyr-32 is in pink, Glu-37 in red, and Arg-68 in blue. Hydrogen bonds are represented by dashed lines and the van der Waals interactions between Glu-37 and Tyr-71 (B) are indicated by a dotted line. In wild-type Ras (A), Arg-68 stabilizes the N terminus of the switch 2 region (60–62) through direct or water-mediated hydrogen bonds. In RasA59G (B), Glu-37 makes hydrogen bonds with Arg-68 and van der Waals interactions with Tyr-71, which protects it partially from the solvent. Tyr-64, which is essential for Sos-binding by Ras, adopts a position that inhibits the docking of the two proteins. The catalytic residue Gln-61 is positioned far from W175. Tyr-32 is making a water-mediated hydrogen bond with the γ-phosphate, and its bulky phenol group is protecting the phosphates from the surrounding solvent. (C) Stereo representation of the superposition of the Cα of switch 1 and 2 regions between the structures of wild-type Ras (green) and RasA59G (gold) in the GppNp-bound form. The residues of L4 are shown, whereas only the side chains of Tyr-32, Glu-37, Gln-61, Arg-68, and Tyr-71 are shown. The two water molecules (W332 and W349) in wild-type Ras that coordinated Arg-68 and that have been exchanged with the solvent on the reorientation of the switch 2 region, are shown. Prepared with MOLSCRIPT (24) and RASTER3D (25).
Fig 2.
Fig 2.
Structural changes that affect the switch 1 and switch 2 regions of Ras along the path for GTP hydrolysis. Structures proceed from the GTP-bound form (Left, PDB coordinates 5P21), to the intermediate (Center) that is represented by the A59G mutant, and finally to the GDP-bound form (Right, PDB coordinates ). Water molecules are shown as red spheres; the nucleotide and the Mg2+-ion are in light blue. Switch 1 is in magenta and switch 2 in gold. Close contacts are represented by dotted lines.
Fig 3.
Fig 3.
(A) Comparison of the GTP-hydrolysis rate of wild-type Ras (closed circles) and RasA59G (open circles). The GTP-hydrolysis rate was measured by using the filter-binding assay. Histidine-tagged Ras proteins (40 pM) were loaded with [γ-32P]GTP (25 Ci/mmol; ICN; 1 Ci = 37 GBq) in 40 mM Hepes/100 mM NaCl/10 mM MgCl2/1 mM DTT, pH 8.0/2 mM EDTA at room temperature. After incubation, MgCl2 was added to a final concentration of 20 mM and samples were placed on ice. GTPase reaction was initiated by incubating at 30°C. Aliquots (20 μl) were taken at appropriate times, and the remaining radioactivity was measured on nitrocellulose filter discs (Millipore HAWPO2500) by using a scintillation counter. Results are shown as percentages of radioactivity bound at time 0. Hydrolysis rates (kcat) were calculated by fitting the experimental points to a single exponential by using SIGMA PLOT (SPSS, Chicago) giving values of 2 × 10⁻⁴ s−1 and 3.5 × 10⁻⁵ s−1 for wild-type Ras and RasA59G, respectively. (B) Binding of RasA59G to the Ras-binding domain (RBD) of the Raf kinase. Glutathione S-transferase-fusion RafRBD was incubated with increasing amounts of wild type (Upper) or A59G (Lower) histidine-tagged Ras loaded with guanosine 5′-O-(3-thiotriphosphate), as indicated. RafRBD/Ras complexes were precipitated with glutathione Sepharose, and the bound material was analyzed by Western blotting with antihistidine antibodies.
Fig 4.
Fig 4.
Intrinsic nucleotide dissociation rates of Ras proteins. Nucleotide dissociation was followed by using the fluorescent nucleotide analogues mant-GDP, mant-GppNp (a nonhydrolyzable GTP-analogue), and mant-GTP, as described in ref. . Purified Ras proteins (1 μM) were loaded with mant-GDP, mant-GppNp, or mant-GTP, as indicated, and incubated in the presence of excess GDP or guanosine 5′-O-(3-thiotriphosphate), respectively. The rate for nucleotide dissociation was determined by the decrease in fluorescence emission at 450 nm over time at room temperature. Data shown are from a single experiment and are representative of three independent measurements. Results are plotted as percentages of mant nucleotide bound to Ras at time 0. Off rates were calculated by fitting the experimental plots to a single exponential. (A) GDP dissociation from wild-type Ras (closed circles, koff = 6.4 × 10⁻⁵ s−1) and RasA59G (open circles, koff = 9.2 × 10⁻⁵ s−1). (B) GppNp-dissociation from wild-type Ras (closed circles, koff = 1.5 × 10⁻⁴ s−1) and RasA59G (open circles, koff = 4.2 × 10⁻⁵ s−1). (C) GTP dissociation from wild-type Ras (closed circles, koff = 4.3 × 10⁻⁵ s−1) and RasE37A (open circles, koff = 1.2 × 10⁻⁴ s−1). (D) GppNp dissociation from wild-type Ras (closed circles, koff = 1.4 × 10⁻⁴ s−1) and RasE37A (open circles, koff = 1.5 × 10⁻⁴ s−1).

References

    1. Barbacid M. (1987) Annu. Rev. Biochem. 56, 779-827. - PubMed
    1. Lowy D. R. & Willumsen, B. M. (1993) Annu. Rev. Biochem. 62, 851-891. - PubMed
    1. Vojtek A. B. & Der, C. J. (1998) J. Biol. Chem. 273, 19925-19928. - PubMed
    1. McCormick F. (1989) Cell 56, 5-8. - PubMed
    1. Bourne H. R., Sanders, D. A. & McCormick, F. (1990) Nature (London) 348, 125-132. - PubMed

Publication types

MeSH terms