. 2002 Sep;14(9):2015-29.
doi: 10.1105/tpc.002733.

Molecular structure of the GARP family of plant Myb-related DNA binding motifs of the Arabidopsis response regulators

Affiliations

Molecular structure of the GARP family of plant Myb-related DNA binding motifs of the Arabidopsis response regulators

Kazuo Hosoda et al. Plant Cell. 2002 Sep.

Abstract

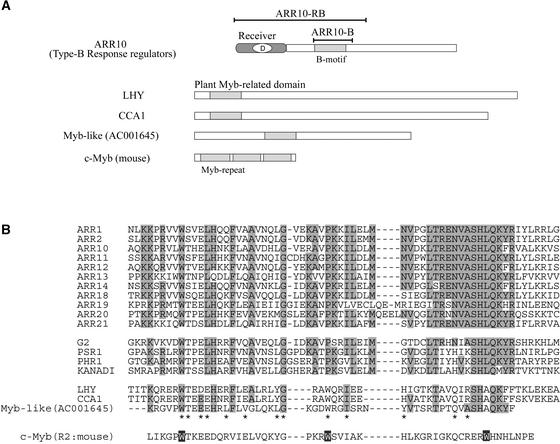
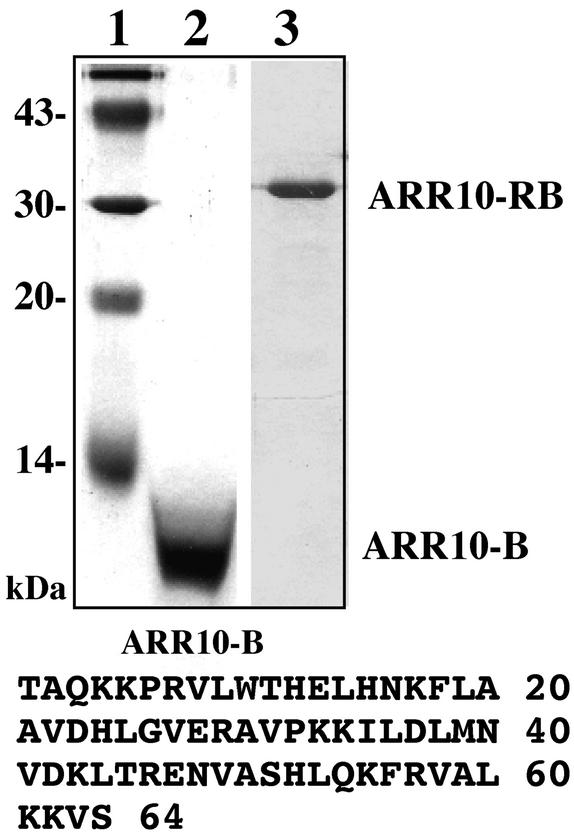
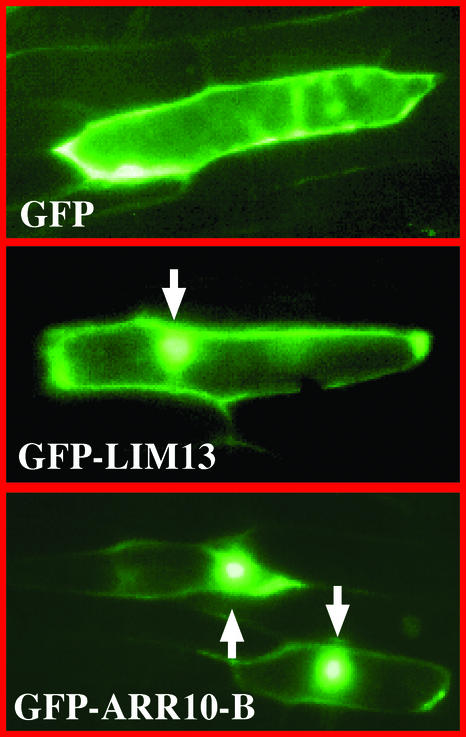
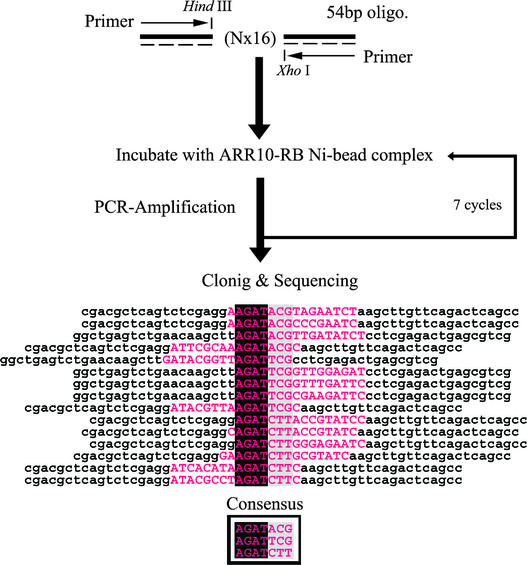
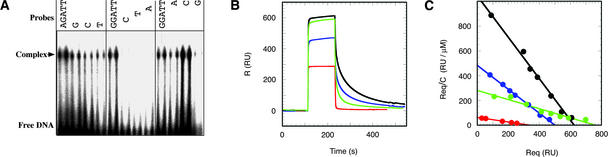
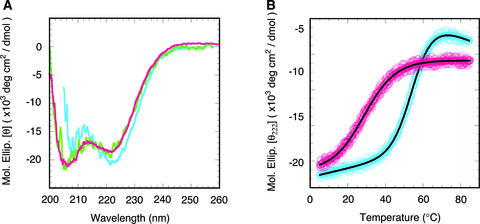
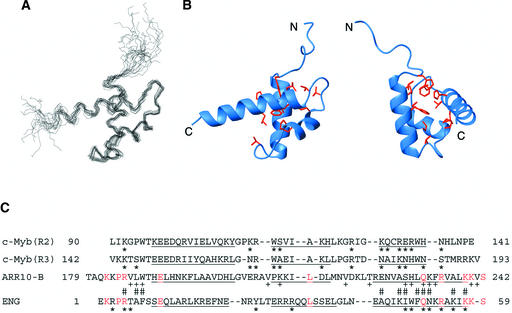
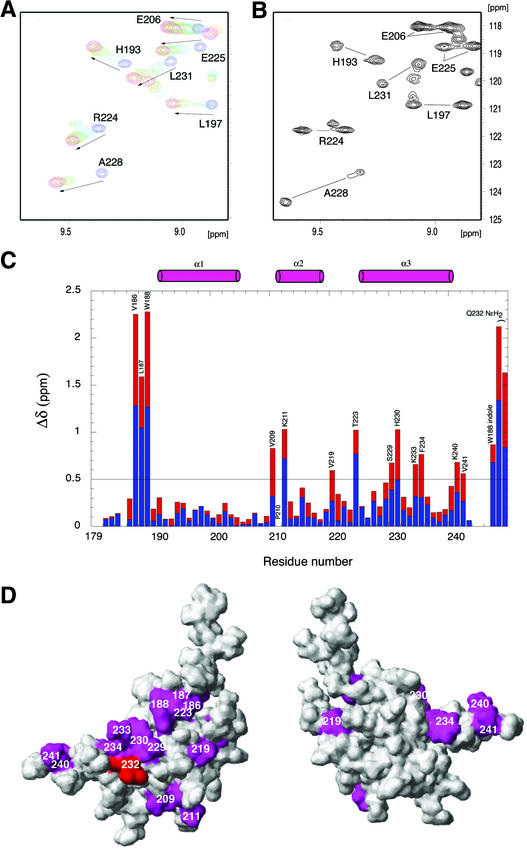
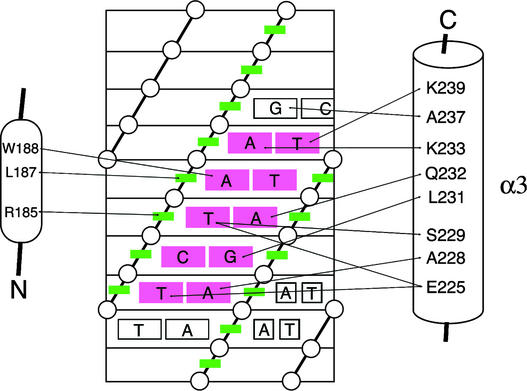
The B motif is a signature of type-B response regulators (ARRs) involved in His-to-Asp phosphorelay signal transduction systems in Arabidopsis. Homologous motifs occur widely in the GARP family of plant transcription factors. To gain general insight into the structure and function of B motifs (or GARP motifs), we characterized the B motif derived from a representative ARR, ARR10, which led to a number of intriguing findings. First, the B motif of ARR10 (named ARR10-B and extending from Thr-179 to Ser-242) possesses a nuclear localization signal, as indicated by the intracellular localization of a green fluorescent protein-ARR10-B fusion protein in onion epidermal cells. Second, the purified ARR10-B molecule binds specifically in vitro to DNA with the core sequence AGATT. This was demonstrated by several in vitro approaches, including PCR-assisted DNA binding site selection, gel retardation assays, and surface plasmon resonance analysis. Finally, the three-dimensional structure of ARR10-B in solution was determined by NMR spectroscopy, showing that it contains a helix-turn-helix structure. Furthermore, the mode of interaction between ARR10-B and the target DNA was assessed extensively by NMR spectroscopy. Together, these results lead us to propose that the mechanism of DNA recognition by ARR10-B is essentially the same as that of homeodomains. We conclude that the B motif is a multifunctional domain responsible for both nuclear localization and DNA binding and suggest that these insights could be applicable generally to the large GARP family of plant transcription factors.


Figures

Figure 1.
Figure 1.
The Type-B Response Regulator 10 (ARR10). (A) The structural design of ARR10, a member of the type-B ARR family, is shown schematically compared with those of three other plant proteins (LHY, CCA1, and Myb-like) and the classic mouse c-Myb oncoprotein. The B motif is similar in length and primary sequence to the Myb repeat of c-Myb and the Myb-related domains of the plant proteins. Two truncated polypeptides were used in this study: ARR10-B, corresponding to the B motif of ARR10; and ARR10-RB, containing both the phospho-accepting receiver domain and the B motif. (B) Amino acid sequences of the B motifs of the type-B ARRs and the corresponding motifs of other GARP proteins. These sequences are compared with those of the plant Myb-related domains and mouse Myb repeats of the proteins listed in (A), and the conserved amino acids are highlighted.
Figure 2.
Figure 2.
Isolation of ARR10-Derived Polypeptides. The polypeptides used in this study were analyzed by SDS-PAGE followed by staining with Coomassie blue. Lane 1, molecular mass marker; lane 2, ARR10-B; lane 3, ARR10-RB. The sequence of ARR10-B's 64 amino acids is shown at bottom.
Figure 3.
Figure 3.
Nuclear Localization of the GFP Fusion Derivative of ARR10-B. The recombinant genes encoding GFP alone, GFP-LIM13, and GFP-ARR10-B were constructed to be under the control of the plant 35S promoter. These DNA constructs were bombarded individually into onion skin epidermal cells. The expression and localization of each product was observed after 24 h of incubation by fluorescence microscopy. Arrows indicate fluorescent nuclei.
Figure 4.
Figure 4.
PCR-Assisted Binding Site Selection. The scheme illustrates the experimental approach for selecting DNA sequences with high affinity for ARR10-RB. A mixture of 54-base oligonucleotides, in which the central 16 bases were of random sequence, was generated by incorporating each of the four nucleotides at equimolar concentration. Each round of selection consisted of incubation of the 54-bp DNA with ARR10-RB Ni bead complexes, with subsequent purification and amplification of bound DNA for use in the next round of selection. The nucleotide sequences of DNA molecules cloned after the seventh round of selection were aligned to infer the consensus sequence. Note that the flanking invariant nucleotides (lowercase letters) are not included in the selected and aligned sequences (uppercase letters in magenta). Four more selected clones also have been sequenced. They were found to contain tandem AGAT or GATTCG, which also are well explained by the proposed consensus sequences. However, they were not included in the alignment for clarity in the figure.
Figure 5.
Figure 5.
DNA Binding Properties of ARR10-B. (A) Purified ARR10-B was subjected to DNA binding gel-shift assay using synthetic 32P-labeled DNA 34-mers containing the core AGAT sequence or its variant GGAT. (B) Surface plasmon resonance sensorgrams for the binding of ARR10-B to four different immobilized DNA 12-mers at a protein concentration of 10 μM: DNA 1 (d-CACTGATTCAGG/d-CCTGAATCAGTG; red), DNA 2 (d-GCAAGATTCGGC/d-GCCGAATCTTGC; black), DNA 3 (d-GCAAGATCAGGC/d-GCCTGATCTTGC; green), and DNA 4 (d-GCAAGATCTTGC/d-GCAAGATCTTGC; blue). The amounts of immobilized DNAs 1, 2, 3, and 4 were 658, 512, 1136, and 476 resonance units (RU), respectively. The control signals, which were generated by flowing ARR10-B through a blank channel without DNA, have been subtracted. (C) Scatchard plots (Req/C versus Req) of signal intensities at the steady states. Kd values were determined to be 5.4, 0.6, 2.7, and 1.0 μM for DNA 1 (red), DNA 2 (black), DNA 3 (green), and DNA 4 (blue), respectively, by fitting the experimental data with the function Req/C = Rmax/Kd − Req/Kd, where Rmax is the maximum response.
Figure 6.
Figure 6.
Secondary Structure and Thermal Stability of ARR10-B. (A) CD spectra of 7.4 μM (green) and 27 μM (magenta) free ARR10-B in 10 mM sodium phosphate buffer, pH 7.0, and of 40 μM ARR10-B bound with DNA 2 (blue) in the same buffer containing 160 mM NaCl. The spectrum of the DNA-bound form of ARR10-B was obtained by subtracting the spectrum of DNA 2 from that of the mixture of ARR10-B and DNA 2. (B) Thermal denaturation curves of the free and DNA-bound forms of ARR10-B. The curve of the free form (magenta circles) was measured for the solution containing 27 μM polypeptide. The curve of the DNA-bound form (blue circles) was obtained by subtracting the curve of DNA 2 from that of the mixture of ARR10-B and DNA 2 at a protein concentration of 40 μM. The solid lines are the best fits to the experimental data based on a two-state model.
Figure 7.
Figure 7.
Three-Dimensional Solution Structure of ARR10-B. (A) The best-fit superposition of the backbone (N, Cα, and C′) atoms of the final 15 structures of ARR10-B. The structures were superimposed against the energy-minimized average structure using the backbone coordinates of residues 188 to 239. (B) Two different views of a ribbon diagram of the energy-minimized average structure of ARR10-B. Side-chain heavy atoms of Trp-188, Leu-192, Phe-196, Val-205, Pro-210, Ile-213, Met-217, Val-219, Leu-222, His-230, and Leu-231 are shown as ball-and-stick models. Hydrophobic interactions between these residues stabilize the three-helix protein structure. The left view is in the same orientation as (A), whereas the right view was obtained by ∼90° clockwise rotation about the vertical axis. (C) Structure-based alignment of the amino acid sequences of ARR10-B, the engrailed homeodomain (ENG), and the second and third repeats of c-Myb. The residues in the α-helices of each structure are underlined. Identical residues between ARR10-B and ENG are highlighted in magenta. Asterisks indicate the residues of c-Myb and ENG that interact with their target DNAs. Residues of ARR10-B with + display large chemical shift changes upon binding to DNA 2, and those with # directly contact DNA 2 (see text).
Figure 8.
Figure 8.
NMR Chemical Shift Perturbation of ARR10-B upon Binding to DNA. (A) Overlay of a selected region of the 1H-15N HSQC spectra obtained at 15°C of ARR10-B in the absence and presence of DNA 1, providing evidence that the binding of ARR10-B to DNA 1 is in fast exchange on the NMR time scale. The arrows show the direction of shifts. ARR10-B/DNA 1 = 1:0 (blue), 1:0.5 (aqua), 1:1 (green), 1:1.5 (orange), and 1:2.5 (magenta). (B) Selected region of the single 1H-15N HSQC spectrum obtained at 15°C of ARR10-B in the presence of 0.3 equivalents of DNA 2, which shows two sets of ARR10-B amide signals from the free and DNA-bound forms in slow exchange. (C) Changes in the NMR chemical shifts of ARR10-B induced by complex formation with DNA 2 and calculated with the function Δδ = |ΔδHN (blue)| + |0.17Δδ15N (red)|. The positions of the α-helices are indicated schematically as cylinders at the top of the figure. (D) Two views of the ARR10-B surface colored magenta to indicate residues whose backbone amide chemical shifts were most sensitive (chemical shift perturbations Δδ > 0.5 ppm) to binding with DNA 2. Note that the side chain of Glu-54, shown in red, was perturbed. The left view is in the same orientation as Figure 7A, whereas the right view was obtained by ∼180° clockwise rotation about the vertical axis.
Figure 9.
Figure 9.
Scheme of the ARR10-B–DNA Interactions. The contacts were derived from intermolecular NOEs between ARR10 and DNA 2. The DNA is represented as a cylindrical projection with phosphates indicated by circles and sugar rings indicated by green boxes. The critical AGATT base pairs are shown in red.

References

    1. Arabidopsis Genome Initiative (2000). Analysis of the genome sequence of the flowering plant Arabidopsis thaliana. Nature 408, 796–815. - PubMed
    1. Bax, A., and Grzesiek, S. (1993). Methodological advances in protein NMR. Acc. Chem. Res. 26, 131–138.
    1. Bax, A., and Subramanian, S. (1986). Sensitivity enhanced two-dimensional heteronuclear shift correlation NMR spectroscopy. J. Magn. Reson. 67, 565–569.
    1. Brünger, A.T. (1993). X-PLOR Manual Version 3.1. (New Haven, CT: Yale University).
    1. Chang, C., Kwok, S.F., Bleeker, A.B., and Meyerowitz, E.M. (1993). Arabidopsis ethylene-response gene ETR1: Similarity of product to two-component regulators. Science 262, 539–544. - PubMed

Publication types

MeSH terms