. 2002 Sep;14(9):2145-60.
doi: 10.1105/tpc.003947.

Alteration of oriented deposition of cellulose microfibrils by mutation of a katanin-like microtubule-severing protein

Affiliations

Alteration of oriented deposition of cellulose microfibrils by mutation of a katanin-like microtubule-severing protein

David H Burk et al. Plant Cell. 2002 Sep.

Abstract

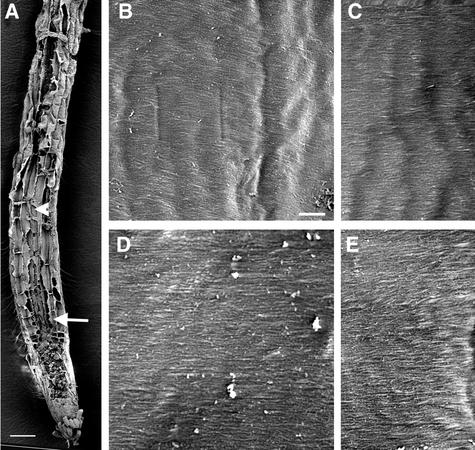
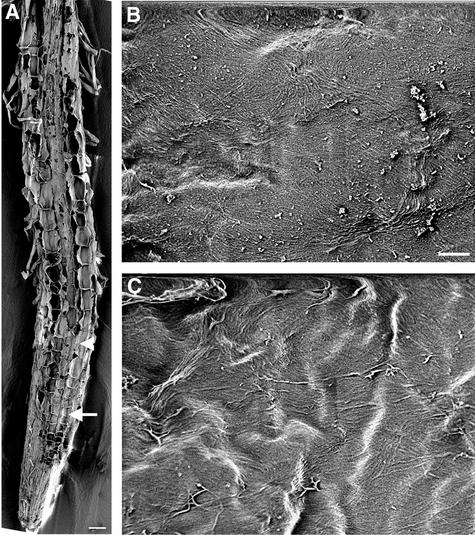
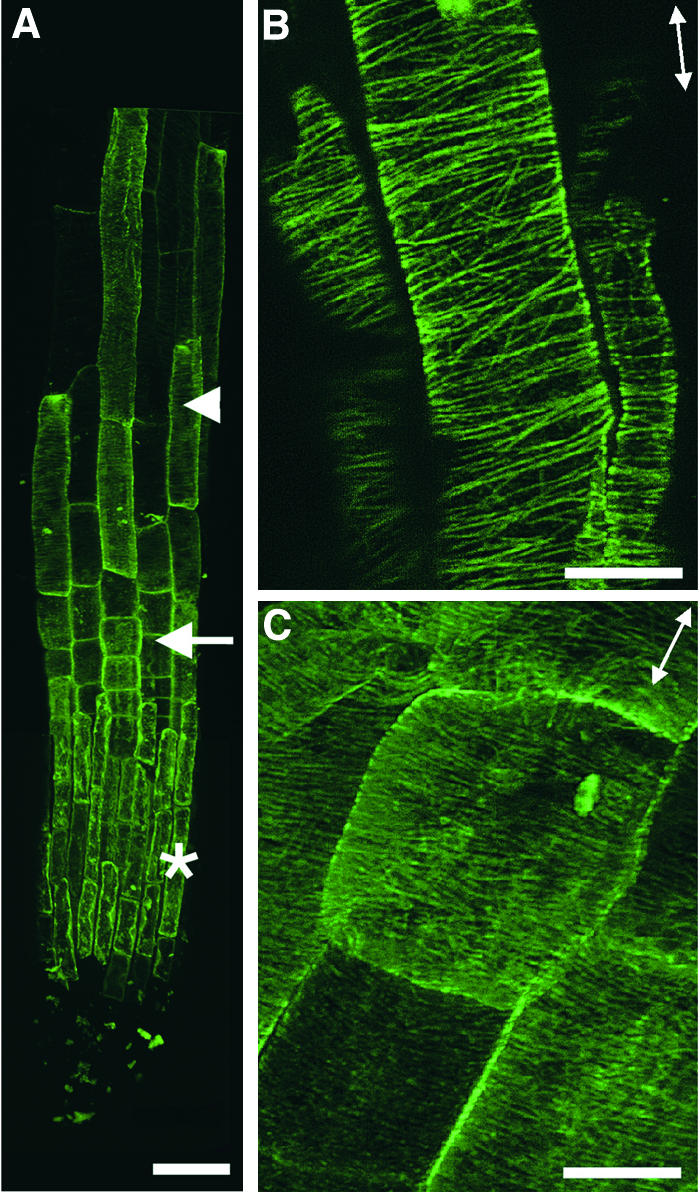
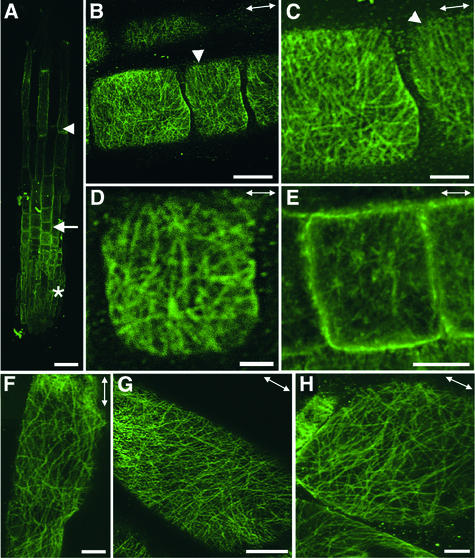
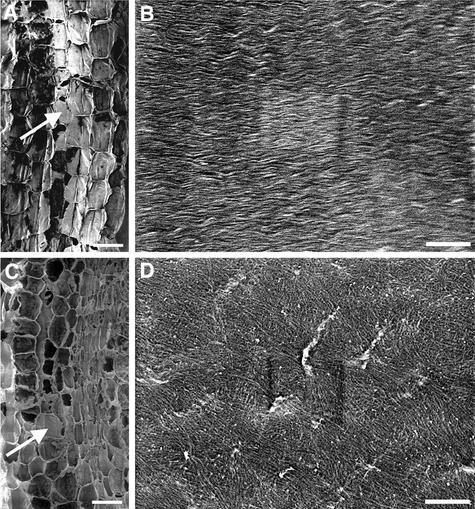
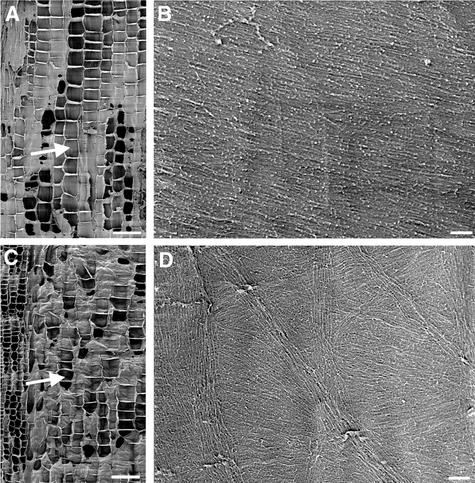
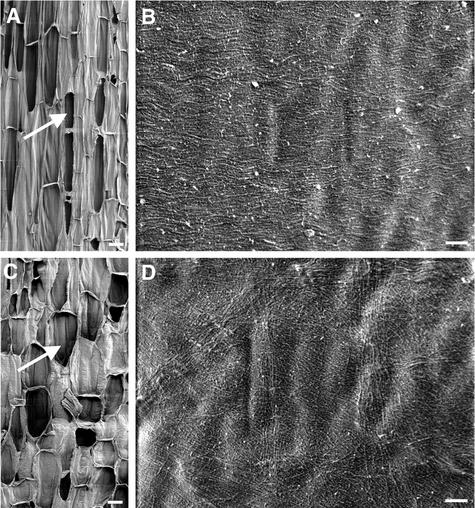
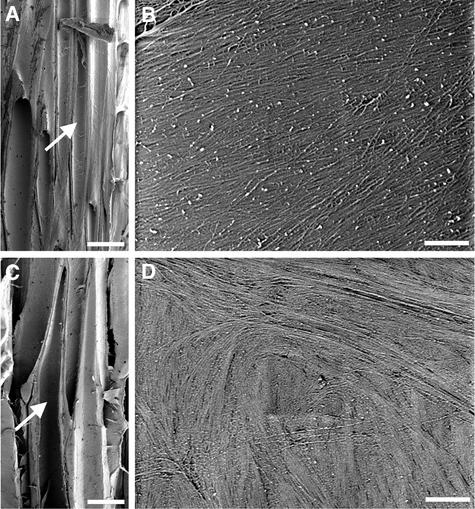
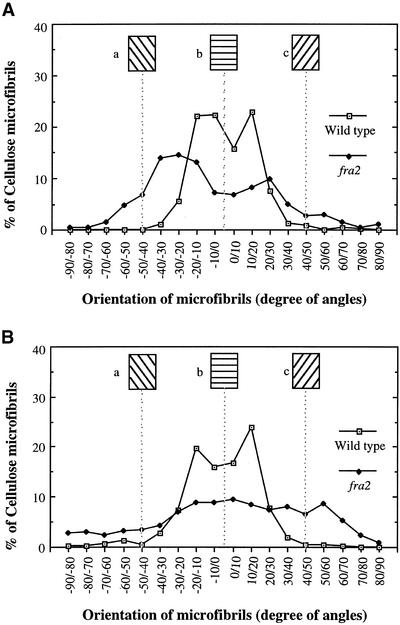
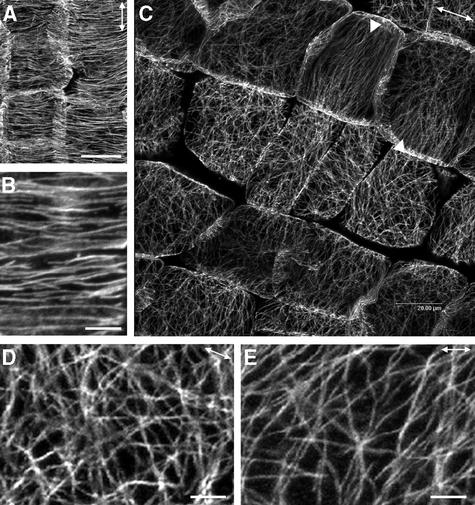
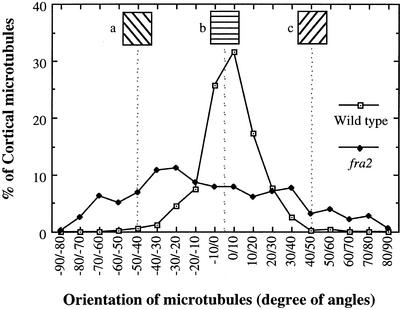
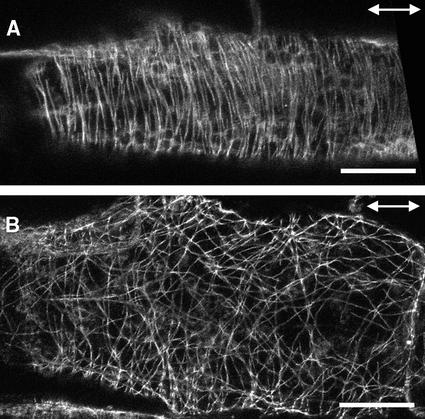
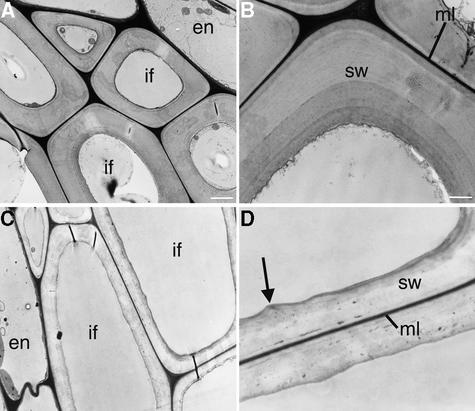
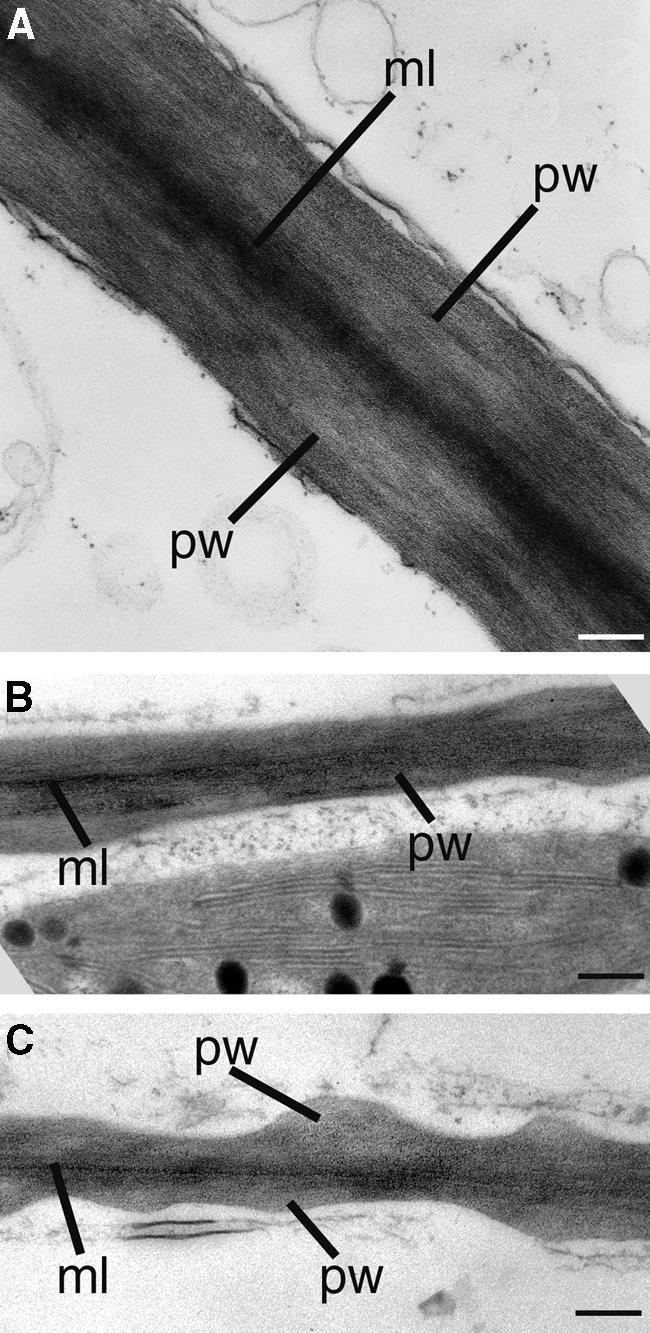
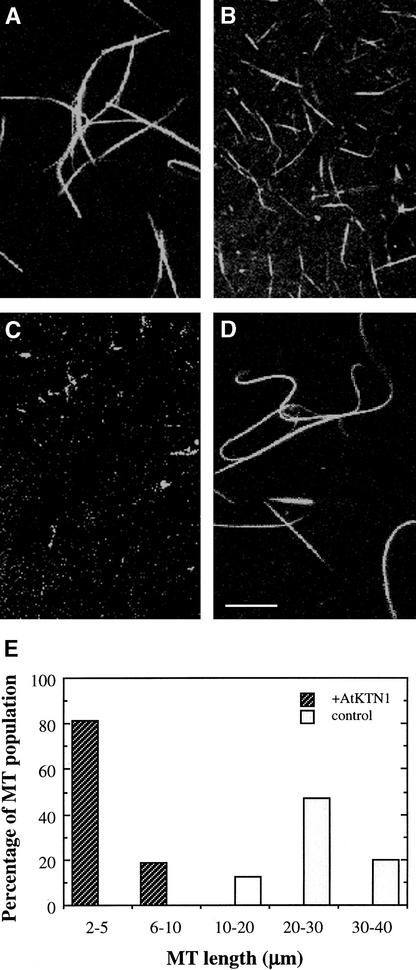
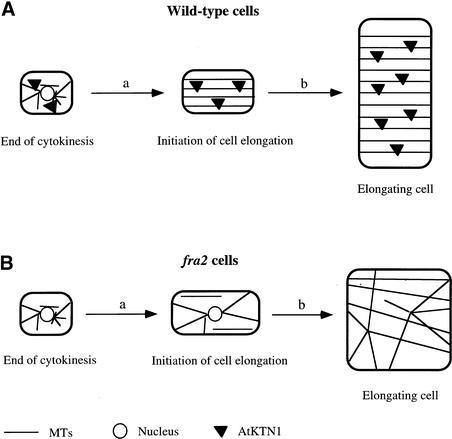
It has long been hypothesized that cortical microtubules (MTs) control the orientation of cellulose microfibril deposition, but no mutants with alterations of MT orientation have been shown to affect this process. We have shown previously that in Arabidopsis, the fra2 mutation causes aberrant cortical MT orientation and reduced cell elongation, and the gene responsible for the fra2 mutation encodes a katanin-like protein. In this study, using field emission scanning electron microscopy, we found that the fra2 mutation altered the normal orientation of cellulose microfibrils in walls of expanding cells. Although cellulose microfibrils in walls of wild-type cells were oriented transversely along the elongation axis, cellulose microfibrils in walls of fra2 cells often formed bands and ran in different directions. The fra2 mutation also caused aberrant deposition of cellulose microfibrils in secondary walls of fiber cells. The aberrant orientation of cellulose microfibrils was shown to be correlated with disorganized cortical MTs in several cell types examined. In addition, the thickness of both primary and secondary cell walls was reduced significantly in the fra2 mutant. These results indicate that the katanin-like protein is essential for oriented cellulose microfibril deposition and normal cell wall biosynthesis. We further demonstrated that the Arabidopsis katanin-like protein possessed MT-severing activity in vitro; thus, it is an ortholog of animal katanin. We propose that the aberrant MT orientation caused by the mutation of katanin results in the distorted deposition of cellulose microfibrils, which in turn leads to a defect in cell elongation. These findings strongly support the hypothesis that cortical MTs regulate the oriented deposition of cellulose microfibrils that determines the direction of cell elongation.


Figures

Figure 1.
Figure 1.
Visualization of Cellulose Microfibrils in the Innermost Layer of Wild-Type Root Cell Walls. Roots of 3-day-old wild-type seedlings were sectioned longitudinally, and the cellulose microfibrils in the innermost layer of cell walls were observed using field emission scanning electron microscopy. Individual microfibrils are seen as distinct lines. The vertical direction of the cellulose microfibril images in all figures corresponds to the elongation axis. Square marks, if present, at the centers of the images in all figures are the result of beam focusing. (A) Longitudinal section of a root showing early-elongating (arrow) and rapidly elongating (arrowhead) cells. (B) and (C) Cellulose microfibrils of rapidly elongating cells showing a transverse orientation along the elongation axis. (D) and (E) Cellulose microfibrils of early-elongating cells showing a transverse orientation along the elongation axis. Bar in (A) = 50 μm; bar in (B) = 0.5 μm for (B) to (E).
Figure 2.
Figure 2.
Visualization of Cellulose Microfibrils in the Innermost Layer of fra2 Root Cell Walls. (A) Longitudinal section of a root showing early-expanding (arrow) and rapidly expanding (arrowhead) cells. (B) and (C) Cellulose microfibrils of rapidly expanding (B) and early-expanding (C) cells showing distorted orientations. Note that bands of microfibrils run in different directions. Bar in (A) = 50 μm; bar in (B) = 0.5 μm for (B) and (C).
Figure 3.
Figure 3.
Visualization of Cortical MTs in Wild-Type Root Epidermal Cells. Roots of 3-day-old seedlings were used for MT labeling with a monoclonal antibody against α-tubulin. Antibody-labeled MTs were detected with fluorescein isothiocyanate–conjugated secondary antibodies, and the signals of fluorescent MTs (green) were visualized using a confocal microscope. Double-headed arrows indicate the elongation axis. (A) View of a whole root tip showing root cap cells (asterisk), early-elongating cells (arrow), and rapidly elongating cells (arrowhead). (B) Rapidly elongating cells showing the transverse orientation of cortical MTs. (C) Early-elongating cells showing the transverse orientation of dense cortical MTs. Bar in (A) = 40 μm; bars in (B) and (C) = 8 μm.
Figure 4.
Figure 4.
Visualization of Cortical MTs in fra2 Root Epidermal Cells. Roots of 3-day-old seedlings were used for immunofluorescent labeling of MTs, and the signals of fluorescent MTs (green) were visualized using a confocal microscope. Double-headed arrows indicate the elongation axis. (A) View of a whole root tip showing root cap cells (asterisk), early-expanding cells (arrow), and rapidly expanding cells (arrowhead). (B) to (E) Early-expanding cells showing aberrant orientations of cortical MTs. Note that many MTs appeared to converge at some common sites. Also note that some regions of cells had cortical MTs aligned in a nearly transverse orientation (arrowheads). (F) to (H) Rapidly expanding cells showing aberrant orientation of cortical MTs. Note that many MTs in (H) appeared to converge at some common sites. Bar in (A) = 40 μm; bars in (B), (E), and (G) = 8 μm; bars in (C), (F), and (H) = 4 μm; bar in (D) = 2 μm.
Figure 5.
Figure 5.
Visualization of Cellulose Microfibrils in the Innermost Layer of Elongating Hypocotyl Cell Walls. (A) Longitudinal section of a wild-type hypocotyl showing elongating cortical cells (arrow). (B) Cellulose microfibrils of a wild-type elongating cortical cell showing a transverse orientation. (C) Longitudinal section of an elongating fra2 hypocotyl showing cortical cells (arrow). (D) Cellulose microfibrils of a fra2 cortical cell showing bands of microfibrils running in different directions. Bars in (A) and (C) = 50 μm; bars in (B) and (D) = 0.5 μm.
Figure 6.
Figure 6.
Visualization of Cellulose Microfibrils in the Innermost Layer of Elongating Pith Cell Walls. (A) Longitudinal section of the elongating region of a wild-type stem showing pith cells (arrow). (B) Cellulose microfibrils in wild-type pith cell walls showing a transverse orientation. (C) Longitudinal section of the elongating region of a fra2 stem showing pith cells (arrow). (D) Cellulose microfibrils in fra2 pith cell walls showing various orientations. Bars in (A) and (C) = 50 μm; bars in (B) and (D) = 0.25 μm.
Figure 7.
Figure 7.
Visualization of Cellulose Microfibrils in the Innermost Layer of Elongating Petiole Cell Walls. (A) Longitudinal section of an elongating wild-type petiole showing parenchyma cells (arrow). (B) Cellulose microfibrils in wild-type parenchyma cell walls showing a transverse orientation. (C) Longitudinal section of an elongating fra2 petiole showing parenchyma cells (arrow). (D) Cellulose microfibrils in fra2 parenchyma cell walls showing a disoriented pattern. Bars in (A) and (C) = 50 μm; bars in (B) and (D) = 0.25 μm.
Figure 8.
Figure 8.
Visualization of Cellulose Microfibrils in the Innermost Layer of Fiber Cell Walls. (A) Longitudinal section of the nonelongating region of a wild-type stem showing interfascicular fiber cells (arrow). (B) Cellulose microfibrils in the middle part of a wild-type fiber cell. Note that microfibrils run in parallel at an angle of 15 to 25° relative to the transverse orientation. (C) Longitudinal section of the nonelongating region of a fra2 stem showing interfascicular fiber cells (arrow). (D) Cellulose microfibrils in the middle part of a fra2 fiber cell showing a disoriented pattern. Bars in (A) and (C) = 25 μm; bars in (B) and (D) = 0.5 μm.
Figure 9.
Figure 9.
Quantitative Analysis of the Orientation of Cellulose Microfibrils. Angles of 450 individual cellulose microfibrils from field emission scanning electron micrographs of the innermost layer of cell walls were measured and are represented in angles at 10° increments. Cellulose microfibrils at different angles were calculated as a percentage of total microfibrils measured. The transverse direction relative to the elongation axis was arbitrarily defined as 0°, and angles deviating from the transverse orientation are represented by positive or negative numbers of degrees. Insets (a), (b), and (c) show the directions of microfibrils corresponding to the defined angles. (A) Cellulose microfibrils in walls of root cortical cells. Cellulose microfibrils in wild-type cell walls were oriented mostly in a transverse direction with a slight deviation, whereas the angles of microfibrils in fra2 cell walls had a much wider distribution. (B) Cellulose microfibrils in walls of pith cells. Cellulose microfibrils in wild-type cell walls showed a prominent transverse orientation with <30° deviation, whereas the angles of microfibrils in fra2 cell walls had a much wider distribution.
Figure 10.
Figure 10.
Visualization of Cortical MTs in Pith Cells of Stems. Pith cells from elongating internodes were used for MT labeling with a monoclonal antibody against α-tubulin. Antibody-labeled MTs were detected with fluorescein isothiocyanate–conjugated secondary antibodies, and the signals of fluorescent MTs were visualized with a confocal microscope. Double-headed arrows indicate the elongation axis. (A) Wild-type pith cells showing the transversely oriented cortical MTs. (B) High-magnification image of cortical MTs in the wild type showing their transverse alignment. (C) fra2 pith cells showing aberrantly oriented cortical MTs. Note that in a few cells, cortical MTs aligned in a nearly transverse orientation (arrowheads). (D) and (E) High-magnification image of cortical MTs in the fra2 mutant showing their aberrant patterns and converging sites. Bars in (A) and (C) = 20 μm; bars in (B), (D), and (E) = 4 μm.
Figure 11.
Figure 11.
Quantitative Analysis of the Orientation of Cortical MTs. Angles of 535 individual cortical MTs from pith cells of the wild type and fra2 were measured and are represented in angles at 10° increments. The number of cortical MTs in a certain angle range was calculated as a percentage of total MTs measured. The transverse direction relative to the elongation axis was arbitrarily defined as 0°, and angles deviating from the transverse direction are represented by positive or negative numbers of degrees. Insets (a), (b), and (c) show the directions of cortical MTs corresponding to the defined angles. Cortical MTs in wild-type cells showed a prominent transverse orientation with <20° deviation, whereas the angles of cortical MTs in fra2 cells had a much wider distribution.
Figure 12.
Figure 12.
Visualization of Cortical MTs in Elongating Petiole Cells. Parenchyma cells from elongating petioles were used for immunofluorescent labeling of MTs. Double-headed arrows indicate the elongation axis. (A) A wild-type petiole parenchyma cell showing the transversely oriented cortical MTs. (B) A fra2 petiole parenchyma cell showing aberrantly oriented cortical MTs. Bars = 20 μm.
Figure 13.
Figure 13.
Structure of Fiber Cell Walls in the Wild Type and the fra2 Mutant. Nonelongating regions of stems of 8-week-old plants were cross-sectioned, and the interfascicular regions in the ultrathin sections were observed with a transmission electron microscope. (A) Interfascicular fiber cells of the wild type showing thick cell walls and small intracellular space. (B) High-magnification image of the secondary wall of a wild-type fiber cell showing clear layers and a smooth inner wall surface. (C) Interfascicular fiber cells of the fra2 mutant showing much thinner cell walls and larger intracellular areas compared with those in the wild type (A). (D) High-magnification image of the secondary wall of a fra2 fiber cell showing no apparent layers and a wavy inner wall surface (arrow). En, endodermal cells; if, interfascicular fiber cells; ml, middle lamella; sw, secondary wall. Bars in (A) and (C) = 2.5 μm; bars in (B) and (D) = 1.1 μm.
Figure 14.
Figure 14.
Structure of Pith Cell Walls in the Wild Type and the fra2 Mutant. Nonelongating regions of stems of 8-week-old plants were cross-sectioned, and the pith cells in the ultrathin sections were observed with a transmission electron microscope. (A) Walls of wild-type pith cells. Note the dark line of the middle lamella. (B) and (C) Walls of fra2 pith cells showing thin walls and wavy inner wall surfaces. ml, middle lamella; pw, primary wall. Bars = 0.21 μm.
Figure 15.
Figure 15.
MT-Severing Activity of Recombinant Arabidopsis Katanin. Recombinant Arabidopsis katanin was expressed in insect cells and purified for assay of MT-severing activity. The purified protein was incubated with taxol-stabilized, rhodamine-labeled MTs, and the lengths of MTs were visualized with a confocal microscope. Typical fields of view are shown. (A) MTs before incubation with recombinant katanin. (B) MTs after incubation with recombinant katanin for 5 min. Note that MTs were cut into short fragments. (C) MTs after incubation with recombinant katanin for 10 min. Note that some very short MTs (<2 μm) were still visible. (D) MTs after incubation with a control protein for 10 min. Bar in (D) = 10 μm for (A) to (D). (E) Distribution of MT lengths. The lengths of MTs were measured 5 min after treatment with a control protein (control) or recombinant Arabidopsis katanin (+AtKTN1). The distribution of MT lengths was expressed as a percentage of the total number of MTs measured (n = 150).
Figure 16.
Figure 16.
Model of the Roles of Katanin (AtKTN1) in the Regulation of the Organization of Cortical MTs, Cellulose Microfibrils, and Directional Cell Elongation. (A) In cells immediately after cytokinesis, AtKTN1 accelerates the formation of cortical MTs by disassembling perinuclear MTs from the nuclear envelope (a). During cell elongation (b), AtKTN1 mediates MT dynamic changes that are required for the transverse orientation of MTs along the elongation axis. The transversely oriented MTs regulate the parallel deposition of cellulose microfibrils, which determines the direction of cell elongation. (B) Lack of AtKTN1 MT-severing activity in the fra2 mutant causes a delay in the disassembly of perinuclear MTs and a concomitant delay of cortical MT formation (a). During cell elongation (b), a decrease in MT dynamics caused by the lack of AtKTN1 MT-severing activity results in aberrant orientations of cortical MTs, which in turn leads to altered cellulose microfibril deposition and a reduction of directional cell elongation.

Similar articles

Cited by

References

    1. Abe, H., Funada, R., Imaizumi, H., Ohtani, J., and Fukazawa, K. (1995). Dynamic changes in the arrangement of cortical microtubules in conifer tracheids during differentiation. Planta 197, 418–421.
    1. Abe, H., Ohtani, J., and Fukazawa, K. (1994). A scanning electron microscopic study of changes in microtubule distributions during secondary wall formation in tracheids. IAWA J. 15, 185–189.
    1. Ahmad, F.J., Yu, W., McNally, F.J., and Baas, P.W. (1999). An essential role for katanin in severing microtubules in the neuron. J. Cell Biol. 145, 305–315. - PMC - PubMed
    1. Baskin, T.I. (2001). On the alignment of cellulose microfibrils by cortical microtubules: A review and a model. Protoplasma 215, 150–171. - PubMed
    1. Bichet, A., Desnos, T., Turner, S., Grandjean, O., and Höfte, H. (2001). BOTERO1 is required for normal orientation of cortical microtubules and anisotropic cell expansion in Arabidopsis. Plant J. 25, 137–148. - PubMed

Publication types

MeSH terms