. 2002 Sep;14(9):2251-64.
doi: 10.1105/tpc.004028.

Suppression of transgene silencing by matrix attachment regions in maize: a dual role for the maize 5' ADH1 matrix attachment region

Affiliations

Suppression of transgene silencing by matrix attachment regions in maize: a dual role for the maize 5' ADH1 matrix attachment region

Cory Brouwer et al. Plant Cell. 2002 Sep.

Abstract

Matrix attachment regions (MARs) are DNA sequences that bind an internal nuclear network of nonhistone proteins called the nuclear matrix. Thus, they may define discrete gene-containing chromatin loops in vivo. We have studied the effects of flanking transgenes with MARs on transgene expression levels in maize callus and in transformed maize plants. Three MAR elements, two from maize (Adh1 5' MAR and Mha1 5' MAR) and one from yeast (ARS1), had very different effects on transgene expression that bore no relation to their affinity for the nuclear matrix in vitro. In callus, two of the MAR elements (Adh1 5' MAR and ARS1) reduced transgene silencing but had no effect on the variability of expression. In transgenic plants, Adh1 5' MAR had the effect of localizing beta-glucuronidase expression to lateral root initiation sites. A possible model accounting for the function of Adh1 5' MAR is discussed.


Figures

Figure 1.
Figure 1.
Binding Assay Results for the Three MARs Used in this Study. Vector and MAR fragments are labeled v and M, respectively. Labeled input DNA, without nuclear matrices, is shown in lane i. Adjacent lanes show the DNA fragments recovered from the matrix fraction in the presence of various concentrations of competitor DNA. (A) Yeast ARS1 sequences (right) bound maize matrices with a lower affinity than the maize Adh1 5′ MAR (left). In the presence of a 1000-fold molar excess of competitor DNA (100 μg/mL), 3% of yeast ARS1 and 10% of Adh1 5′ MAR remained matrix bound. (B) Mha1 5′ MAR (left) displayed the highest affinity for binding to the matrix. In the presence of a 1500-fold molar excess of competitor (150 μg/mL), 30% of Mha1 5′ MAR remained bound, whereas under the same conditions, only 3.5% of Adh1 5′ MAR (right) remained bound. (C) Binding of Mha1 5′ MAR in the presence of different concentrations of E. coli DNA or 50 ng/mL unlabeled Adh1 5′ MAR (left). Nine percent of Mha1 5′ MAR remained bound to the matrix in the presence of 50 ng/mL unlabeled Adh1 5′ MAR. When the binding of labeled Adh1 5′ MAR was challenged with different concentrations of unlabeled Mha1 5′ MAR (right), 25 ng/mL of the specific competitor left only 3% of Adh1 5′ MAR bound to the matrix, and 50 ng/mL unlabeled Mha1 5′ MAR completely abolished the matrix binding of Adh1 5′ MAR.
Figure 2.
Figure 2.
Vectors Used in the Transformation and Transient Assay Studies. (A) The vectors used for BMS transformations. In the first construct, for PHP264, the open reading frame (ORF) equals GUS; for PHP1528, ORF equals LUC; and for PHP3528, ORF equals BAR. In the second construct, for PHP5438, MAR equals ARS1 and ORF equals LUC; for PHP5456, MAR equals ARS1 and ORF equals BAR; for PHP6248, MAR equals Adh1 5′ and ORF equals LUC; for PHP6344, MAR equals Adh1 5′ and ORF equals BAR; for PHP6486, MAR equals Mha1 5′ and ORF equals LUC; and for PHP6487, MAR equals Mha1 5′ and ORF equals BAR. The third construct is PHP6086 containing the Rsyn7 promoter. The fourth construct is PHP7917 containing the Rsyn7 promoter and the Adh1 5′ MAR elements. (B) Effects of MARs on the transient expression of 35S::LUC. Five replicas for each treatment were assayed for LUC and GUS expression. The 35S::LUC vectors PHP1528, PHP5483 (ARS1), PHP6248 (Adh1), and PHP6486 (Mha1) were mixed 5:1 with the 35S::GUS vector PHP264. Relative levels of gene expression were calculated by normalizing LUC to the level of GUS expression. An F test indicated no significant difference between means (P = 0.21). LU, light units.
Figure 3.
Figure 3.
DNA Gel Blot Analysis and Copy-Number Frequency Distribution for BMS Transgenic Lines. (A) A random sample of stably transformed lines representing independent transformation events. The lines shown were from two filters from the same bombardment experiment. Lanes marked M contained molecular mass marker fragments. Lanes 1C and 5C show hybridization signals from one and five transgene copies, respectively. (B) Copy numbers of random samples of BASTA-resistant BMS calli transformed with low-dose DNA. Lines with predominantly one or two copy numbers per genome are shown in lanes 1 to 6. High-dose DNA resulted in multiple insertions, which are shown in lanes 7 to 12. Lanes 1C and 5C are as described in (A).
Figure 4.
Figure 4.
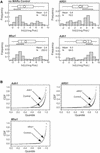
LUC Expression in BMS Transformants. (A) Transgene expression level distributions are shown in the histograms. The y axis corresponds to LUC expression on a logarithmic scale [ln(LU/μg protein)], where LU indicates light units. Above each histogram is an outlier box plot. The box represents the interquartile range, or the difference between the 25th and 75th percentiles. The “whiskers” (the horizontal lines outside of the box) represent the range (computed as 150% of the interquartile range). The vertical line inside the box represents the median, and the diamond represents the mean. The bracket underneath the box identifies the most dense 50% of all observations. All distributions were bimodal, and the shape of the distributions is similar for no-MARs and Mha1, indicating that Mha1 had no effect on expression. ARS1 and Adh1 both increased the expression level and shifted the majority of expressing events to the higher expressing peak of the bimodal distribution. (B) Cumulative distribution function (CDF) graphs. Adh1 5′ MAR and ARS1 both have distributions significantly different from that of the no-MAR control. Mha1 5′ MAR has the same distribution as the no-MAR control.
Figure 5.
Figure 5.
N-fold difference graph of LUC expression in BMS. BASTA-resistant transformants were classified as nonexpressors (black bars), low expressors (gray bars), or high expressors (white bars), as described in Results. A single expression value [4 ln(LU/μg protein)] was used as the cutoff for all data sets. Values indicate the n-fold difference from the control without MARs in numbers of transformants in each category. The main effect of ARS1 and Adh1 MARs was to increase the number of high-expressing events at the expense of nonexpressors and low expressors. Mha1 had no effect on expression levels.
Figure 6.
Figure 6.
Plants Stably Transformed with the Rsyn7-Driven GUS Gene. Histochemical analysis of GUS expression in roots of transgenic maize plants transformed with Rsyn7::GUS unflanked (A) or flanked ([B] and [C]) with Adh1 5′ MAR. The expression patterns in (B) and (C) show GUS activity primarily at the sites of lateral root emergence (arrowheads).

Similar articles

Cited by

References

    1. Allen, G.C., Hall, G.E., Jr., Childs, L.C., Weissinger, A.K., Spiker, S., and Thompson, W.F. (1993). Scaffold attachment regions increase reporter gene expression in stably transformed plant cells. Plant Cell 5, 603–613. - PMC - PubMed
    1. Allen, G.C., Hall, G.E., Jr., Michalowski, S., Newman, W., Weissinger, A.K., Spiker, S., and Thompson, W.F. (1996). High level transgene expression in plant cells: Effects of a strong scaffold attachment region from tobacco. Plant Cell 8, 899–913. - PMC - PubMed
    1. Amati, B.B., and Gasser, S.M. (1988). Chromosomal ARS and CEN elements bind specifically to the yeast nuclear scaffold. Cell 54, 967–978. - PubMed
    1. An, C., Mitra, A., Choi, H.K., Costa, M.A., An, K., Thornburg, R.W., and Ryan, C.A. (1989). Functional analysis of the 3′ control region of the potato wound-inducible proteinase inhibitor II gene. Plant Cell 1, 115–122. - PMC - PubMed
    1. Ananiev, E.V., Phillips, R.L., and Rines, H.W. (1998). Complex structure of knob DNA on maize chromosome 9: Retrotransposon invasion into heterochromatin. Genetics 149, 2025–2037. - PMC - PubMed

Publication types

LinkOut - more resources