. 2002 Nov 8;277(45):43377-88.
doi: 10.1074/jbc.M206373200. Epub 2002 Sep 5.

Protein kinase C-alpha and ERK1/2 mediate mitochondrial dysfunction, decreases in active Na+ transport, and cisplatin-induced apoptosis in renal cells

Affiliations

Protein kinase C-alpha and ERK1/2 mediate mitochondrial dysfunction, decreases in active Na+ transport, and cisplatin-induced apoptosis in renal cells

Grazyna Nowak. J Biol Chem. .

Abstract

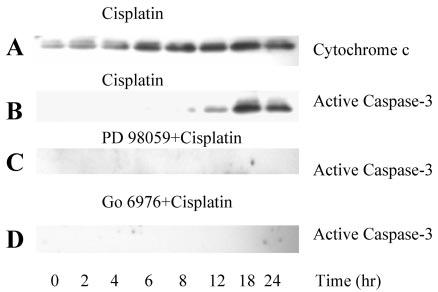
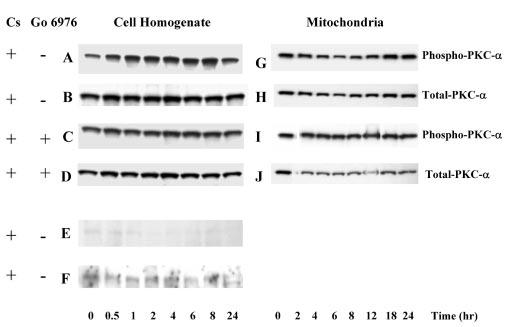
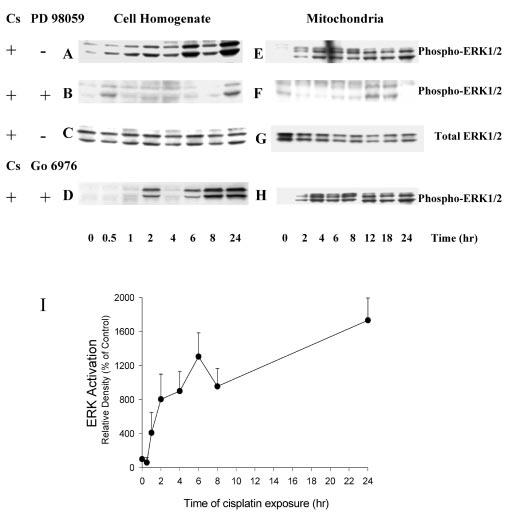
Initiation of apoptosis by many agents is preceded by mitochondrial dysfunction and depolarization of the mitochondrial inner membrane. Here we demonstrate that, in renal proximal tubular cells (RPTC), cisplatin induces mitochondrial dysfunction associated with hyperpolarization of the mitochondrial membrane and that these events are mediated by protein kinase C (PKC)-alpha and ERK1/2. Cisplatin induced sustained decreases in RPTC respiration, oxidative phosphorylation, and increases in the mitochondrial transmembrane potential (deltaPsi(m)), which were preceded by the inhibition of F(0)F(1)-ATPase and cytochrome c release from the mitochondria, accompanied by caspase-3 activation, and followed by RPTC apoptosis. Cisplatin also decreased active Na+ transport as a result, in part, of the inhibition of Na+/K(+)-ATPase. These changes were preceded by PKC-alpha and ERK1/2 activation. Inhibition of cisplatin-induced PKC-alpha and ERK1/2 activation using Go6976 and PD98059, respectively, abolished increases in deltaPsi(m), diminished decreases in oxidative phosphorylation, active Na+ transport, and decreased caspase-3 activation without blocking cytochrome c release. Caspase inhibitor benzyloxycarbonyl-Val-Ala-Asp-fluoromethylketone (zVAD-fmk) did not prevent increases in deltaPsi(m). Furthermore, inhibition of PKC-alpha did not prevent cisplatin-induced ERK1/2 activation. We concluded that in RPTC: 1) cisplatin-induced mitochondrial dysfunction, decreases in active Na+ transport, and apoptosis are mediated by PKC-alpha and ERK1/2; 2) PKC-alpha and ERK1/2 mediate activation of caspase-3 by acting downstream of cytochrome c release from mitochondria; and 3) ERK1/2 activation by cisplatin occurs through a PKC-alpha-independent pathway.


Figures

Fig. 1
Fig. 1. The effect of cisplatin on basal oxygen consumption (QO2) and oligomycin-sensitive QO2 (A) and uncoupled QO2 (B)
RPTC were treated with 50 μm cisplatin, and samples were taken at 1, 2, 4, 8, 12, and 24 h of cisplatin exposure for measurements of QO2. Control RPTC were treated with vehicle (Me2SO) alone. Basal QO2 in controls did not change over the course of 24 h. Basal QO2 (●) represents the total amount of oxygen consumed by RPTC and was measured as described under “Experimental Procedures.” Oligomycin-sensitive QO2 (○) was measured in the presence of oligomycin (0.6 μg/ml) and calculated as a difference between basal and oligomycin-insensitive QO2. Uncoupled QO2 (■) was measured after addition of FCCP (2 μm). Results are the average ± S.E. of six experiments (RPTC isolations).
Fig. 2
Fig. 2. The effect of cisplatin on F0F1-ATPase activity (A) and intracellular ATP content (B)
A, RPTC were treated with 50 μm cisplatin and mitochondria were isolated at 1, 2, 4, 8, 12, 18, and 24 h of cisplatin exposure. The F0F1-ATPase activity assay was performed at 31 °C in 10 mm Tris-HCl, pH 8.2, containing 200 mm KCl, 3 mm MgCl2, and RPTC mitochondria. The reaction was initiated by the addition of ATP (5 mm) and terminated after 5 min by adding 3 m trichloroacetic acid to precipitate protein. The inorganic phosphate concentration in the supernatant was determined using Sumner reagent. Each mitochondrial sample was run in the absence and presence of oligomycin (10 μg/ml), and the F0F1-ATPase activity was expressed as the oligomycin-sensitive phosphate production. Results are the average ± S.E. of three experiments (RPTC isolations). B, RPTC were treated with 50 μm cisplatin and samples were taken at 1, 2, 4, 8, 18, and 24 h of cisplatin exposure for measurements of intracellular ATP content. Results are the average ± S.E. of five experiments (RPTC isolations).
Fig. 3
Fig. 3. Mitochondrial hyperpolarization induced by cisplatin exposure in RPTC
RPTC were treated with 50 μm cisplatin and loaded with 10 μm JC-1 for 30 min at 37 °C, washed twice with ice-cold PBS, and overlaid with ice-cold PBS. The live RPTC monolayers were examined under Zeiss fluorescent microscope (Axioskop) using water-immersion objective. Original magnification, ×400. A, controls. B, RPTC treated with 50 μm cisplatin for 18 h. C, RPTC treated with 50 μm cisplatin for 24 h. Inset, a single cell (original magnification, ×800). D, mitochondrial depolarization in RPTC induced by FCCP (2 μm). These images are representative of three independent experiments (cell isolations).
Fig. 4
Fig. 4. Quantification of JC-1 accumulation in mitochondria (red fluorescence) and cytoplasm (green fluorescence) in cisplatin-treated RPTC
RPTC monolayers were exposed to 50 μm cisplatin for 24 h and loaded with 10 μm JC-1 for 30 min at 37 °C. After loading, media were aspirated and monolayers kept on ice, washed twice with ice-cold PBS, scraped off culture dishes, washed, and resuspended in PBS. Fluorescence was analyzed by flow cytometry (BD Biosciences FACSCalibur) using excitation by 488 nm argon-ion laser. The JC-1 monomer (green fluorescence) and J-aggregate (red fluorescence) were detected in FL1 (emission, 525 nm) and FL2 (emission, 590 nm) channels, respectively. A, the effect of cisplatin on JC-1 accumulation in RPTC mitochondria. B, the effect of inhibition of ERK1/2 (50 μm PD98059) on cisplatin-induced accumulation of JC-1 in mitochondria. C, the effect of inhibition of PKC-α (10 nm Go6976) on cisplatin-induced accumulation of JC-1 in mitochondria. Experiments were performed five times with comparable results.
Fig. 5
Fig. 5. The effect of cisplatin exposure on Δψm in RPTC
RPTC monolayers were treated and analyzed as described in the legend to Fig. 4. A, the effect of cisplatin on the average red fluorescence of JC-1 in RPTC. B, the effect of cisplatin on the red/green fluorescence ratio of JC-1 in RPTC. Results are the average ± S.E. of seven experiments (RPTC isolations).
Fig. 6
Fig. 6. The effect of cisplatin exposure on the release of cyto-chrome c to RPTC cytosol and activation of caspase-3
At different time points of cisplatin exposure, RPTC cytosol was isolated as described under “Experimental Procedures” and protein levels of cyto-chrome c and active caspase 3 (17–19-kDa cleaved fragment) determined by immunoblotting. A, the effect of cisplatin exposure on the release of cytochrome c to the RPTC cytosol. B, the effect of cisplatin on caspase-3 cleavage in RPTC. C, the effect of ERK1/2 inhibition (50 μm PD98059) on caspase-3 cleavage during cisplatin exposure in RPTC. D, the effect of PKC-α inhibition (10 nm Go6976) on caspase-3 cleavage during cisplatin exposure in RPTC. Experiments were performed three times with comparable results.
Fig. 7
Fig. 7. The effect of cisplatin on active Na+ transport
A, the effect of cisplatin on ouabain-sensitive QO2. RPTC were treated with cisplatin, and samples were taken at 1, 2, 4, 8, 12, and 24 h of exposure for measurements of QO2. Ouabain-sensitive QO2 in controls did not change over the course of 24 h. Ouabain-sensitive QO2 was measured in the presence of 1.0 mm ouabain and calculated as a difference between basal and ouabain-insensitive QO2. B, the effect of cisplatin on the activity of Na+/K+-ATPase in RPTC. RPTC were treated with 50 μm cisplatin, and samples were taken at 2 and 24 h of exposure for measurements of Na+/K+-ATPase activity as described under “Experimental Procedures.” □, control RPTC treated with vehicle (Me2SO); ■, RPTC treated with 50 μm cisplatin. Results are the average ± S.E. of six independent experiments (RPTC isolations).
Fig. 8
Fig. 8. The effect of cisplatin on PKC-α, PKC-δ, and PKC-ε in RPTC
RPTC were treated with 50 μm cisplatin and samples were taken at 0, 0.5, 1, 2, 4, 6, 8, 12, 18, and 24 h for measurements of protein levels of phosphorylated (active) and total PKC-α, PKC-δ, and PKC-ε using immunoblotting. Samples were processed as described under “Experimental Procedures” and proteins separated using 10% SDSPAGE. Following electroblotting of the proteins to a nitrocellulose membrane, blots were blocked for 1 h in Tris-buffered saline containing 0.5% casein and 0.1% Tween 20, and incubated overnight at 4 °C in the presence of anti-phospho-PKC-α, anti-phospho-PKC-δ, anti-phospho-PKC-ε antibodies, or anti-PKC-α antibody diluted in the blocking buffer. Following washing, the membranes were incubated for 1 h with anti-rabbit or anti-mouse IgG coupled to horseradish peroxidase and washed again. The supersignal chemiluminescent system was used for protein detection and scanning densitometry for quantification of results. A–F, protein levels of phospho-PKC-α, phospho-PKC-δ, and phospho-PKC-ε in RPTC homogenates. G–J, protein levels of phospho-PKC-α in RPTC mitochondria. Go6976 (10 nm) was added 1 h prior to cisplatin exposure. Presented data are representative of three independent experiments (cell isolations).
Fig. 9
Fig. 9. Activation of ERK1/2 during cisplatin exposure in RPTC
RPTC were treated with 50 μm cisplatin, and samples were taken at 0, 0.5, 1, 2, 4, 6, 8, 12, 18, and 24 h for measurements of protein levels of phosphorylated and total ERK1/2 using immunoblotting. Immunoblotting was performed as described in the legend to Fig. 8. A–D, protein levels of phospho- and total ERK1/2 in RPTC homogenates. E–H, protein levels of phospho- and total ERK1/2 in RPTC mitochondria. PD98059 (50 μm) and Go6976 (10 nm) were added 1 h prior to cisplatin treatment. Presented data are representative of three independent experiments (cell isolations). I, cisplatin-induced ERK1/2 activation quantified by densitometry. Results are the average ± S.E. of three independent experiments (RPTC isolations).
Fig. 10
Fig. 10. The effect of inhibition of PKC-α and ERK1/2 activation on transient (2 h) and sustained (24 h) changes in oxidative phosphorylation (A), electron transport rate (B), and the mitochondrial membrane potential (C) induced by cisplatin (50 μm) in RPTC
The monolayers were treated and RPTC functions analyzed as described under “Experimental Procedures.” White columns, controls; black columns, 50 μm cisplatin; light gray columns, 50 μm PD98059 + 50 μm cisplatin; dark gray columns, 10 nm Go6976 + 50 μm cisplatin; hatched columns, 3 μm UO126 + 50 μm cisplatin; striped columns, 50 μm zVAD-fmk + 50 μm cisplatin. Results are the average ± S.E. of three to five independent experiments (RPTC isolations).
Fig. 11
Fig. 11. The effect of inhibition of PKC-α and ERK1/2 activation on transient (2 h) and sustained (24 h) changes in ouabain-sensitive oxygen consumption (A) and Na+/K+-ATPase activity (B) induced by cisplatin (50 μm) in RPTC
The monolayers were treated and ouabain-sensitive oxygen consumption and Na+/K+-ATPase activity analyzed as described under “Experimental Procedures.” White columns, controls; black columns, 50 μm cisplatin; light gray columns, 50 μm PD98059 + 50 μm cisplatin; dark gray columns, 10 nm Go6976 + 50 μm cisplatin. Results are the average ± S.E. of three independent experiments (RPTC isolations).
Fig. 12
Fig. 12. The effect of cisplatin on caspase-3
Caspase-3 activity was quantified by fluorometric detection of free AFC after cleavage from 50 μm DEVD-AFC, and the amount of product cleaved was determined from the AFC standard curve. A, the effect of inhibitors of ERK1/2 activation (50 μm PD98059 and 3 μm UO126) on cisplatin (50 μm)-induced caspase-3 activation. B, the effect of inhibition of PKC-α activation (10 nm Go6976) or treatment with caspase inhibitor (50 μm Z-VAD) on cisplatin (50 μm)-induced caspase-3 activation. Results are the average ± S.E. of four to nine independent experiments (RPTC isolations).
Fig. 13
Fig. 13. Cisplatin-induced alterations in nuclear morphology in RPTC
At 24 h of cisplatin exposure, RPTC monolayers were fixed in 3.7% formaldehyde, incubated in the presence of 8 μm DAPI for 2 h at room temperature, and evaluated under Zeiss fluorescent microscope (Axioskop). Pictures were taken using Hamamatsu color chilled 3CCD digital camera. A, control; B, 50 μm cisplatin; C, 50 μm PD98059; D, 50 μm PD98059 + 50 μm cisplatin; E, 10 nM Go6976; F, 10 nm Go6976 + 50 μm cisplatin. Presented data are representative of three independent experiments (cell isolations). Original magnification, ×400.

References

    1. Goldstein RS, Mayor GH. Life Sci. 1983;32:685–690. - PubMed
    1. Safirstein RL, Winston J, Moel D, Dikman S, Guttenplan J. Int. J. Androl. 1987;10:325–346. - PubMed
    1. Miura K, Goldstein RS, Pasino DA, Hook JB. Toxicology. 1987;44:147–158. - PubMed
    1. Ikeda S, Fukuzaki A, Kaneto H, Ishidoya S, Orikasa S. Int. J. Urol. 1999;6:245–250. - PubMed
    1. Osman AM, El-Sayed EM, El-Demerdash E, Al-Hyder A, El-Didi M, Attia AS, Hamada FM. Pharm. Res. 2000;41:115–121. - PubMed

Publication types

MeSH terms