Comparative Study
. 2002 Sep 17;41(37):11277-83.
doi: 10.1021/bi026161s.

Site-directed mutagenesis of conserved charged amino acid residues in ClpB from Escherichia coli

Affiliations
Comparative Study

Site-directed mutagenesis of conserved charged amino acid residues in ClpB from Escherichia coli

Micheal E Barnett et al. Biochemistry. .

Abstract

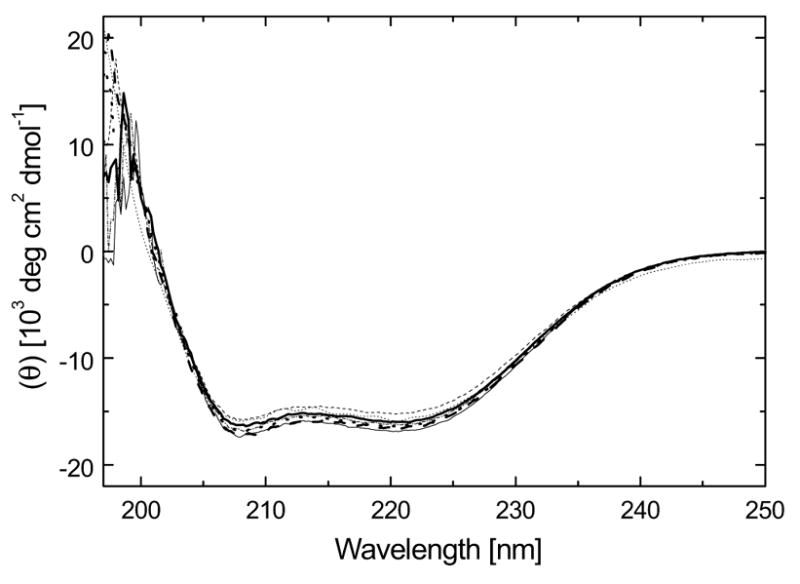
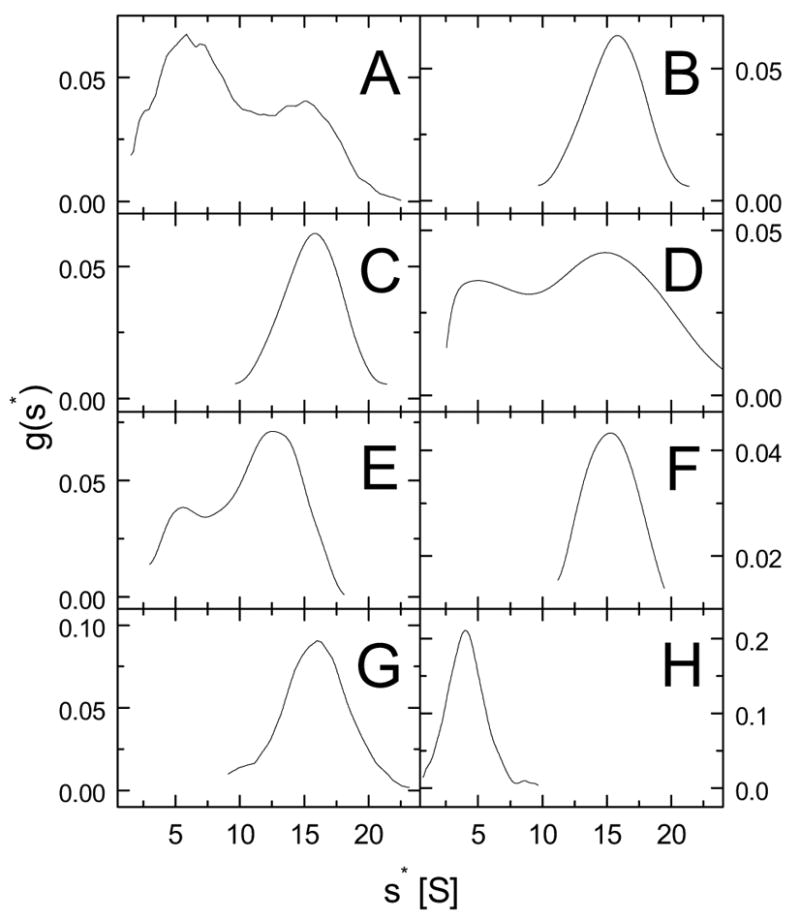
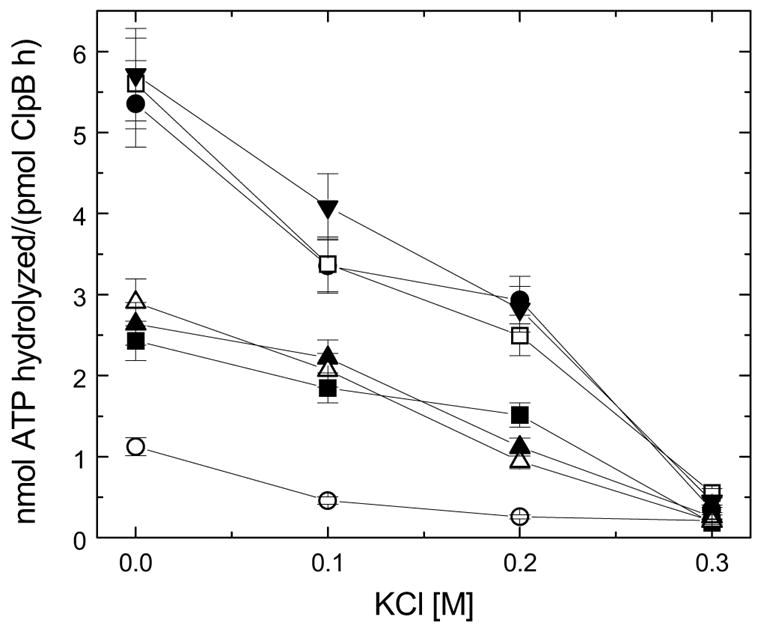
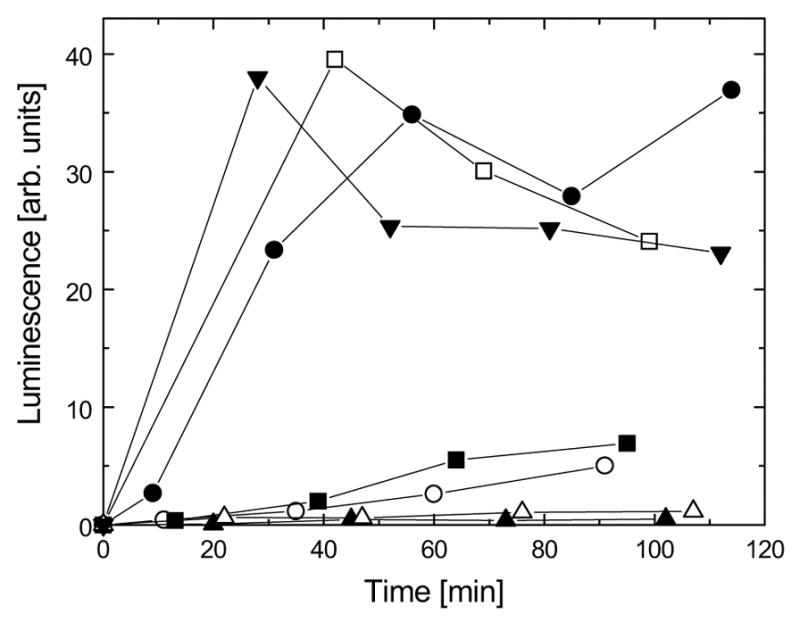
ClpB is a member of a multichaperone system in Escherichia coli (with DnaK, DnaJ, and GrpE) that reactivates strongly aggregated proteins. The sequence of ClpB contains two ATP-binding domains, each containing Walker consensus motifs. The N- and C-terminal sequence regions of ClpB do not contain known functional motifs. In this study, we performed site-directed mutagenesis of selected charged residues within the Walker A motifs (Lys212 and Lys611) and the C-terminal region of ClpB (Asp797, Arg815, Arg819, and Glu826). We found that the mutations K212T, K611T, D797A, R815A, R819A, and E826A did not significantly affect the secondary structure of ClpB. The mutation of the N-terminal ATP-binding site (K212T), but not of the C-terminal ATP-binding site (K611T), and two mutations within the C-terminal domain (R815A and R819A) inhibited the self-association of ClpB in the absence of nucleotides. The defects in self-association of these mutants were also observed in the presence of ATP and ADP. The four mutants K212T, K611T, R815A, and R819A showed an inhibition of chaperone activity, which correlated with their low ATPase activity in the presence of casein. Our results indicate that positively charged amino acids that are located along the intersubunit interface (this includes Lys212 in the Walker A motif of the N-terminal ATP-binding domain as well as Arg815 and Arg819 in the C-terminal domain) participate in intersubunit salt bridges and stabilize the ClpB oligomer. Interestingly, we have identified a conserved residue within the C-terminal domain (Arg819) which does not participate directly in nucleotide binding but is essential for the chaperone activity of ClpB.


Figures

Figure 1
Figure 1
Postulated domain structure of ClpB and positions of mutations. (A) The diagram shows two nucleotide binding domains (NBD1, NBD2) enclosed between the N-terminal and C-terminal regions and separated with the middle domain. Sequences of Walker-A motifs within NBD1 and NBD2 are shown below and the mutated lysine residues are indicated with arrows. (B) Sequence alignment of the C-terminal regions from seven Hsp100 proteins: ClpB from Escherichia coli, ClpA from Escherichia coli, ClpX from Escherichia coli, Hsp104 from Saccharomyces cerevisiae, Hsp 101 from Arabidopsis thaliana, HslU (ClpY) from Escherichia coli, and ClpC from Listeria monocytogenes. The alignment was produced with T-COFFEE, version 1.37 and the output was created with Boxshade (http://www.ch.embnet.org). Identical matches and conservative substitutions are highlighted in black and grey, respectively. Arrows indicate the amino acids in ClpB that were chosen for mutations.
Figure 1
Figure 1
Postulated domain structure of ClpB and positions of mutations. (A) The diagram shows two nucleotide binding domains (NBD1, NBD2) enclosed between the N-terminal and C-terminal regions and separated with the middle domain. Sequences of Walker-A motifs within NBD1 and NBD2 are shown below and the mutated lysine residues are indicated with arrows. (B) Sequence alignment of the C-terminal regions from seven Hsp100 proteins: ClpB from Escherichia coli, ClpA from Escherichia coli, ClpX from Escherichia coli, Hsp104 from Saccharomyces cerevisiae, Hsp 101 from Arabidopsis thaliana, HslU (ClpY) from Escherichia coli, and ClpC from Listeria monocytogenes. The alignment was produced with T-COFFEE, version 1.37 and the output was created with Boxshade (http://www.ch.embnet.org). Identical matches and conservative substitutions are highlighted in black and grey, respectively. Arrows indicate the amino acids in ClpB that were chosen for mutations.
Figure 2
Figure 2
Far-UV circular dichroism (CD) spectra of ClpB and its mutant forms at room temperature. The CD signal is expressed as mean molar residue ellipticity (θ) and shown for wt ClpB (thick solid line), K212T (thick dashed line), K611T (thick dotted line), D797A (thin solid line), R815A (thin dashed line), R819A (thin dotted line), E826A (dot-dashed line). The protein concentration was 2.0 mg/ml in 50 mM Hepes-KOH, pH 7.5, 0.2 M KCl, 20 mM MgCl2, 1 mM EDTA, 2 mM β- mercaptoethanol.
Figure 3
Figure 3
Sedimentation velocity of ClpB and its mutant forms. Ultracentrifugation was performed at 40,000 rpm at 20 °C. The protein concentration was 4.0 mg/ml in 50 mM Hepes-KOH, pH 7.5, 0.2 M KCl, 20 mM MgCl2, 1 mM EDTA, 2 mM β-mercaptoethanol. Protein concentration profiles were measured using absorption at 290 nm. Shown are radial scans of the centrifuge cell taken at 3-minute intervals for K212T (A), K611T (B), D797A (C), R815A (D), R819A (E), and E826A (F). The direction of sedimentation is to the right, and the solution menisci are indicated by the light-scattering peaks at ~6.2–6.3 cm.
Figure 4
Figure 4
Apparent sedimentation coefficient distributions for ClpB and its mutant forms. Shown are the results of the time-derivative analysis (26) of four late protein concentration profiles (see Figure 3) for K212T (A), K611T (B), D797A (C), R815A (D), R819A (E), E826A (F), wt ClpB (G), and the C-terminally truncated ClpBΔC (H). The lines show apparent distribution functions g(s*) versus the sedimentation coeficient s* in in Svedberg units (S). The data for wt ClpB and ClpBΔC are from Barnett et al. (20).
Figure 5
Figure 5
Gel filtration analysis of ClpB and its mutant forms in the presence of nucleotides. Aliquots of wt ClpB (A), K212T (B), K611T (C), R815A (D), and R819A (E) were injected onto a Superose 6 column (10 μl of 2.0 mg/ml protein). Protein elution profiles were obtained with a 0.05 ml/min flow rate (running buffer: 50 mM Tris-HCl, pH 7.5, 0.2 M KCl, 20 mM MgCl2, 1 mM EDTA, 1 mM DTT) in the absence of nucleotides (solid line), with 2 mM ATP in the running buffer (dashed line), or with 2 mM ADP (dotted line) by monitoring absorption at 290 nm. Circles in panel A correspond to the elution times of thyroglobulin (Mr 670,000), γ-globulin (Mr 158,000), ovalbumin (Mr 44,000), and myoglobin (Mr 17,000). The data obtained with an analogous procedure for the mutants D797A and E826A are similar to those shown in panels A and C.
Figure 6
Figure 6
ATP hydrolysis by ClpB and its mutant forms. ATPase activity of ClpB was measured by incubating 5 μg/ml ClpB (filled circles), K212T (open circles), K611T (filled squares), D797A (open squares), R815A (filled triangles), R819A (open triangles), or E826A (upside-down triangles) for 15 min at 37 °C in the assay buffer (100 mM Tris-HCl, pH 8.0, 10 mM MgCl2, 5 mM ATP, 1 mM EDTA, 1 mM DTT, 0.1 mg/ml κ-casein) with indicated concentration of KCl.
Figure 7
Figure 7
Reactivation of luciferase by ClpB and its mutant forms in the presence of DnaK, DnaJ, and GrpE. Unfolded luciferase was diluted at room temperature into the refolding buffer (see Experimental Procedures) containing DnaK, DnaJ, GrpE, and wt ClpB (filled circles), K212T (open circles), K611T (filled squares), D797A (open squares), R815A (filled triangles), R819A (open triangles), or E826A (upside-down triangles). Luciferase activity was measured in aliquots withdrawn after the times indicated. Protein concentrations in the refolding solutions were 25 nM luciferase, 0.3 μM ClpB, 1.0 μM DnaK, 1.1 μM DnaJ, 1.2 μM GrpE.

References

    1. Schirmer EC, Glover JR, Singer MA, Lindquist S. Trends Biochem Sci. 1996;21:289–296. - PubMed
    1. Glover JR, Tkach JM. Biochem Cell Biol. 2001;79:557–568. - PubMed
    1. Neuwald AF, Aravind L, Spouge JL, Koonin EV. Genome Res. 1999;9:27–43. - PubMed
    1. Vale RD. J Cell Biol. 2000;150:F13–F19. - PMC - PubMed
    1. Weber-Ban EU, Reid BG, Miranker AD, Horwich AL. Nature. 1999;401:90–93. - PubMed

Publication types

LinkOut - more resources