. 2002 Sep 16;158(6):1119-31.
doi: 10.1083/jcb.200112067. Epub 2002 Sep 9.

Adenovirus triggers macropinocytosis and endosomal leakage together with its clathrin-mediated uptake

Affiliations

Adenovirus triggers macropinocytosis and endosomal leakage together with its clathrin-mediated uptake

Oliver Meier et al. J Cell Biol. .

Abstract

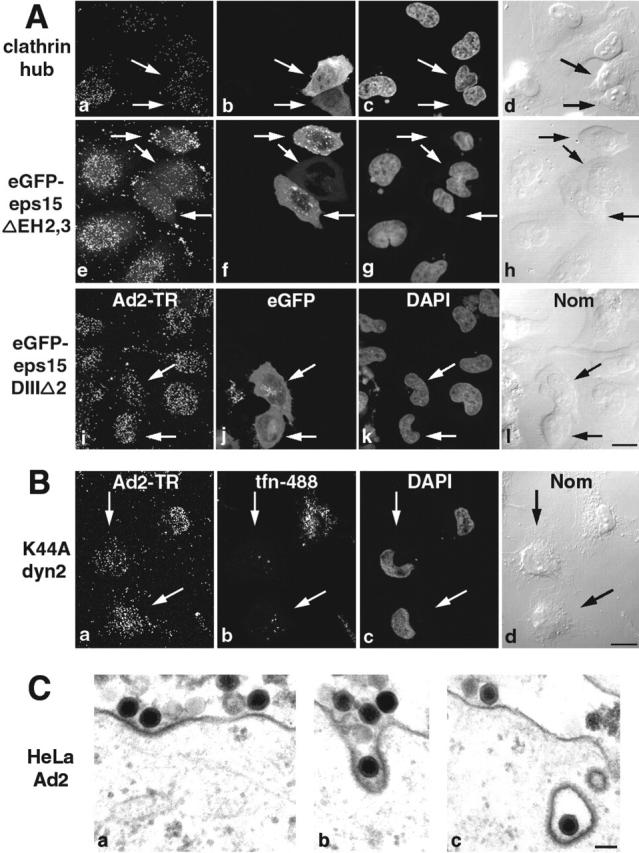
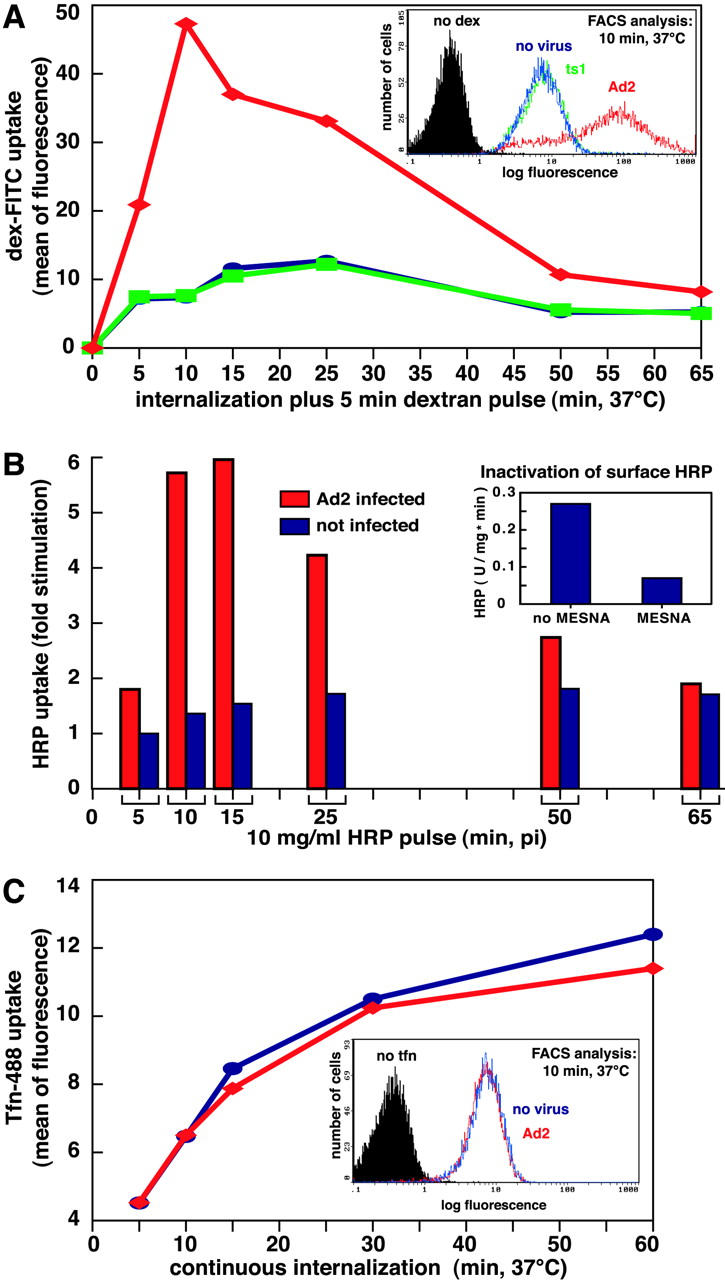
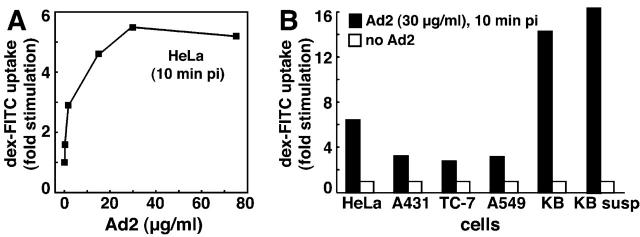
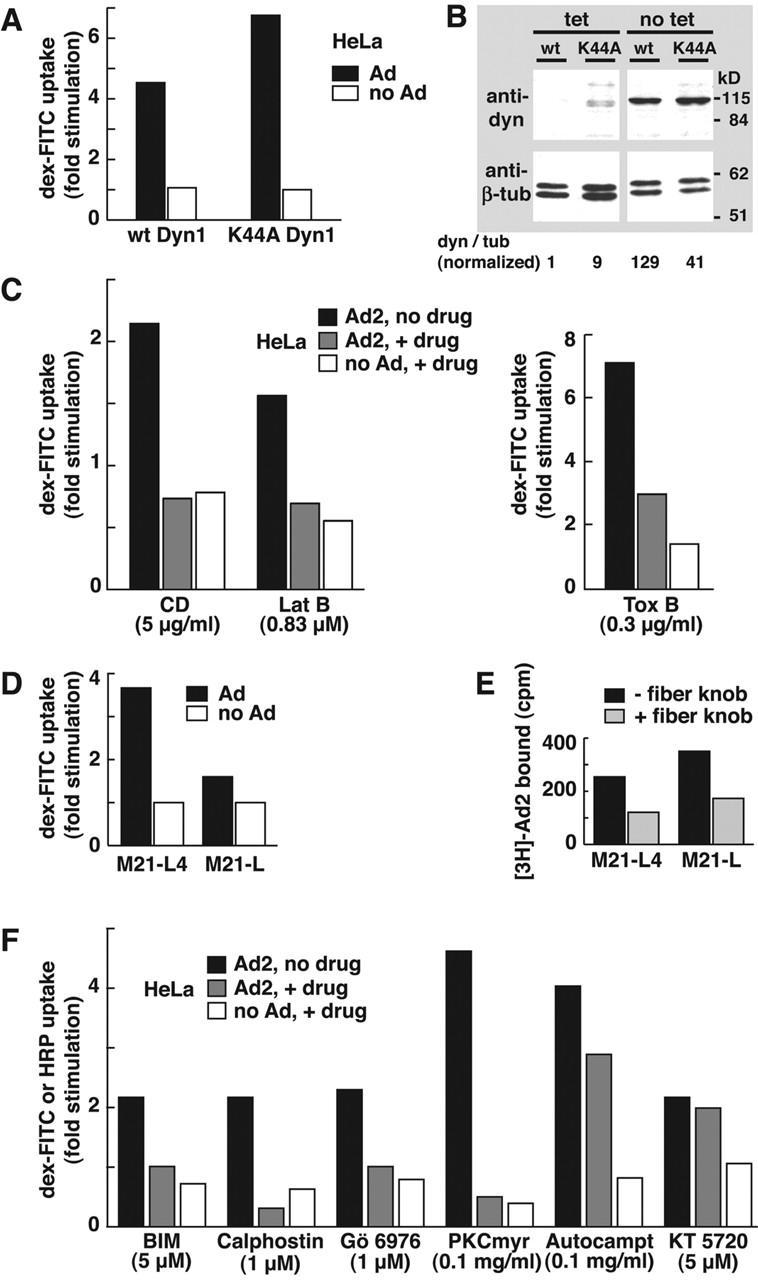
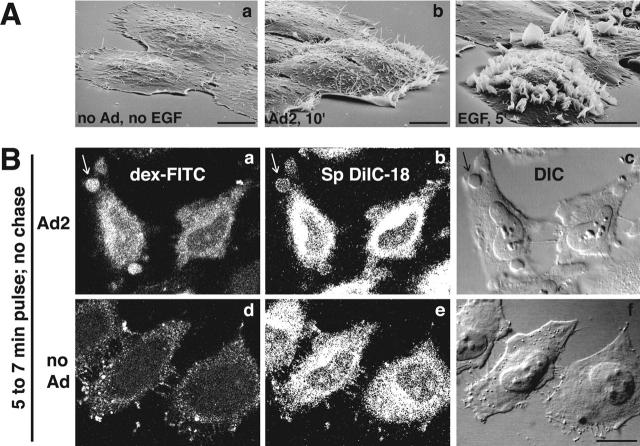
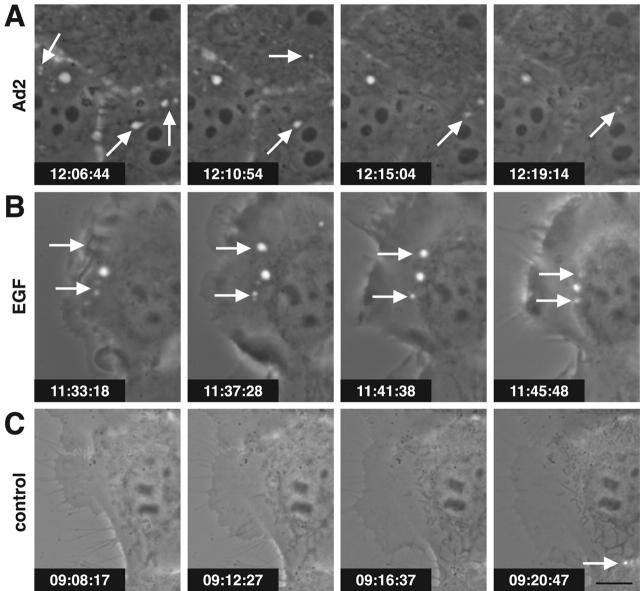
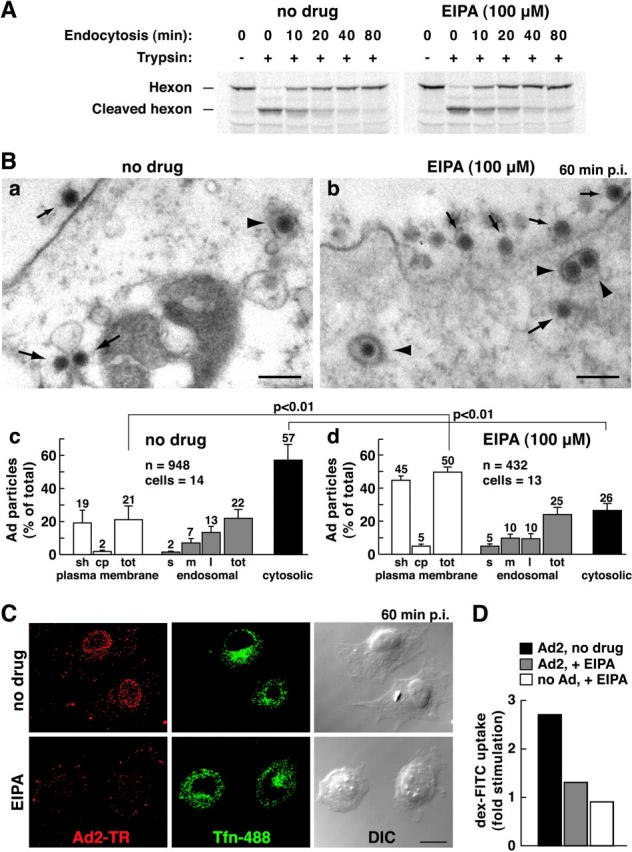
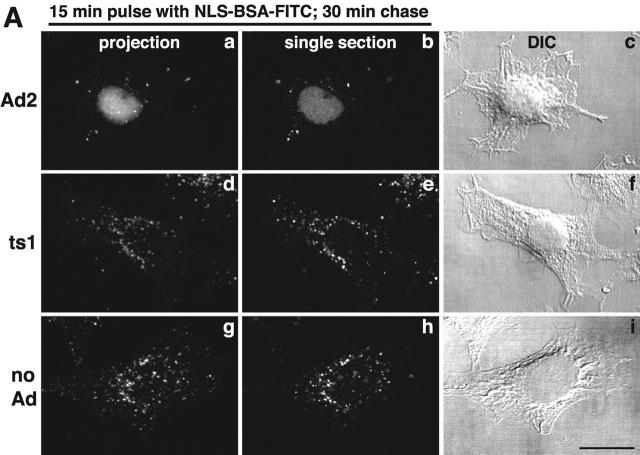
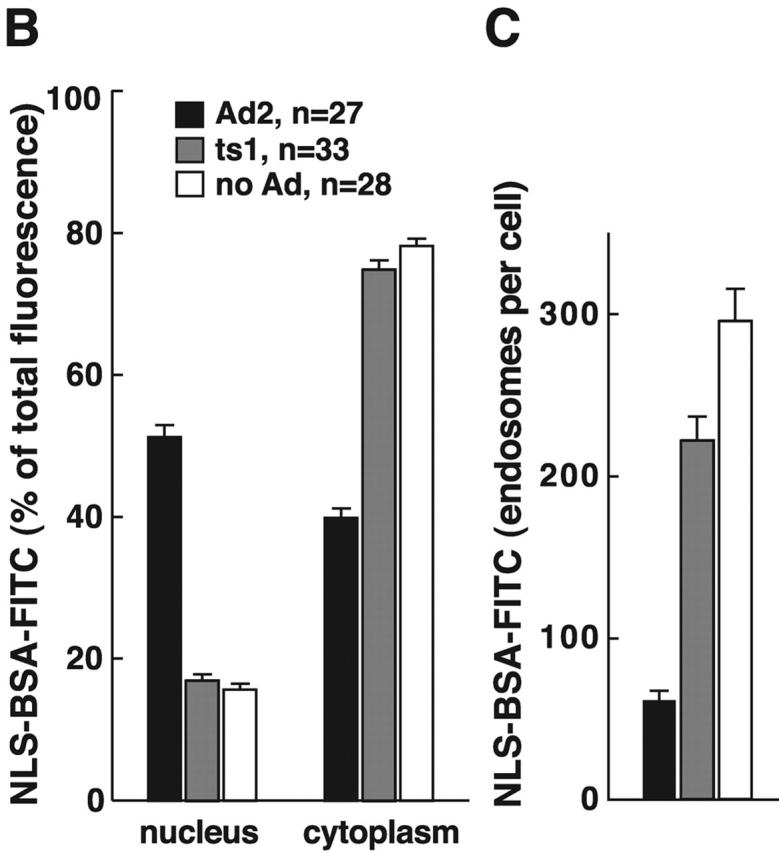
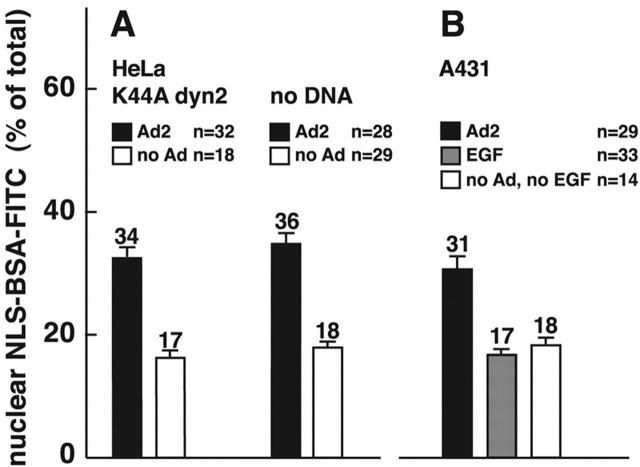
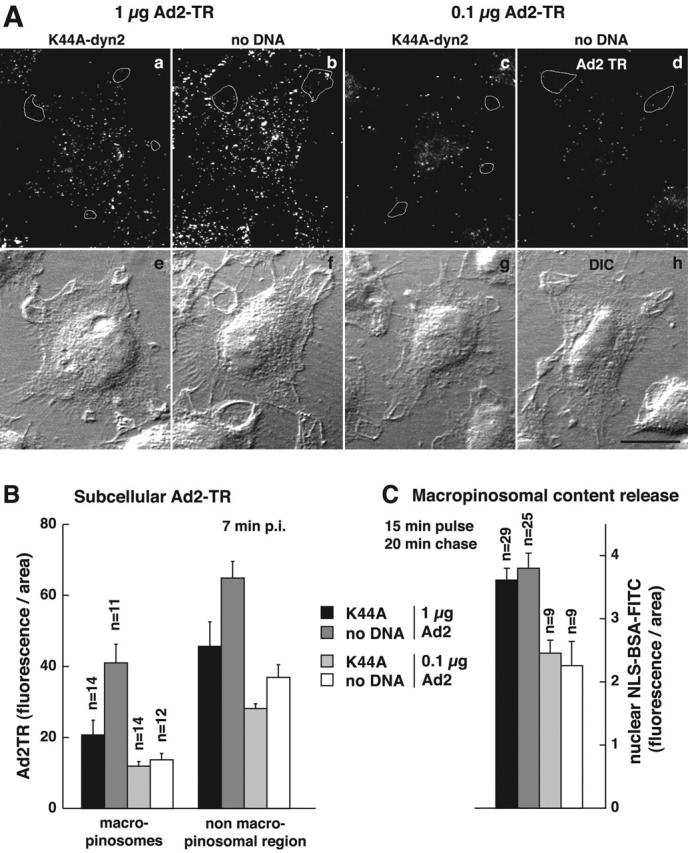
Adenovirus type 2 (Ad2) binds the coxsackie B virus Ad receptor and is endocytosed upon activation of the alphav integrin coreceptors. Here, we demonstrate that expression of dominant negative clathrin hub, eps15, or K44A-dynamin (dyn) inhibited Ad2 uptake into epithelial cells, indicating clathrin-dependent viral endocytosis. Surprisingly, Ad strongly stimulated the endocytic uptake of fluid phase tracers, coincident with virus internalization but without affecting receptor-mediated transferrin uptake. A large amount of the stimulated endocytic activity was macropinocytosis. Macropinocytosis depended on alphav integrins, PKC, F-actin, and the amiloride-sensitive Na+/H+ exchanger, which are all required for Ad escape from endosomes and infection. Macropinocytosis stimulation was not a consequence of viral escape, since it occurred in K44A-dyn-expressing cells. Surprisingly, 30-50% of the endosomal contents were released into the cytosol of control and also K44A-dyn-expressing cells, and the number of fluid phase-positive endosomes dropped below the levels of noninfected cells, indicating macropinosomal lysis. The release of macropinosomal contents was Ad dose dependent, but the presence of Ad particles on macropinosomal membranes was not sufficient for contents release. We conclude that Ad signaling from the cell surface controls the induction of macropinosome formation and leakage, and this correlates with viral exit to the cytosol and infection.


Figures

Figure 1.
Figure 1.
Clathrin-mediated uptake of Ad2 into HeLa cells. (A) Cells were transfected with T7-clathrin hub (a–d), eGFP–eps15ΔEH2,3 (e–h), or the control plasmid eGFP–eps15DIIIΔ2 (i–l), for 24 h and infected with Ad2-TR for 75 min. Transfected cells (arrows) were identified by mouse anti-T7 and FITC goat anti–mouse antibody (b) or eGFP expressions (f and j). The Ad2-TR optical stacks were projected in panels a, e, and i, and three merged sections across the middle of the cells show the transfected cells (b, f, and j) and DAPI stainings of nuclei (c, g, and k), respectively. DIC images (Nom) of cells are in panels d, h, and l. Bar, 20 μm. (B) Cells expressing K44A-dyn2 (arrows) were infected with Ad2-TR (a) and characterized by tfn-488 uptake (b). Arrows identifying cells lacking tfn uptake. Bar, 20 μm. (C) Transmission EM of incoming Ad2 at the plasma membrane (a), in a coated pit (b), and a coated vesicle (c). Bar, 100 nm. See also Fig. S1 available at http://www.jcb.org/cgi/content/full/jcb.200112067/DC1.
Figure 2.
Figure 2.
Ad transiently stimulates fluid phase but not tfn uptake. (A) FACS® analysis of dex-FITC uptake into Ad2-infected HeLa cells (♦, red), ts1-infected cells (▪, green), and noninfected cells (•, blue). Cells with cold bound Ad2 or ts1 (30 μg/ml) were warmed and pulsed with dex-FITC 5 min before washing and analysis by FACS®. A typical plot of cell number versus FITC fluorescence (log scale) is shown in the inset (10 min p.i.). (B) HRP uptake into Ad2-infected (red) and noninfected HeLa cells (blue). Cells were pulsed with HRP for 5 min (as in A), surface HRP was inactivated by MESNA treatment at pH 8.5 (inset), and intracellular HRP activity (units mg−1 min−1) was determined spectrophotometrically in cell lysates. Results are expressed as fold stimulation of HRP uptake with respect to noninfected cells at 5 min after warming. (C) Transferrin uptake. Infected and noninfected HeLa cells were starved in DME-BSA for 5 h, incubated with tfn-488 (10 μg/ml), acid washed in the cold at pH 5.5 to remove ∼90% of the surface-attached tfn (not depicted), and analyzed for green fluorescence by flow cytometry. Results are expressed as mean values of tfn-488. The inset depicts cell number as a function of tfn-488 fluorescence in log scale at 10 min p.i.
Figure 3.
Figure 3.
Ad dose-dependent stimulation of pinocytosis. (A) HeLa cells were incubated with Ad2 in the cold for 60 min, washed, warmed for 5 min followed by a pulse of dex-FITC for 5 min, harvested, and analyzed by FACS®. Results are expressed as fold stimulation of dex uptake compared with noninfected cells. (B) HeLa, A431, TC7, A549, and KB cells were grown on plastic dishes or in suspension (susp), incubated with Ad2 (30 μg/ml) and dex-FITC, and analyzed by FACS® as described above.
Figure 4.
Figure 4.
Actin- and integrin-dependent but dyn-independent stimulation of fluid phase uptake. (A) Dyn-independent stimulation of pinocytosis. Parallel dishes of HeLa cells were derepressed for dyn1 and K44A-dyn1 expressions and incubated with 50 μg/ml Ad2 in the cold, washed, pulsed with dex-FITC for 15 min, and chased for 15 min. Dex uptake was determined by FACS® analysis. (B) Derepression of dyn expression in HeLa cells. HeLa cells stably transformed with wild-type (wt) dyn1 or K44A-dyn1 cDNAs were incubated in the absence of tet for 90 h and analyzed by Western blotting using mouse anti-dyn and anti–β-tubulin antibodies (tub), respectively. (C) Actin dependence of pinocytosis stimulation. HeLa cells were pretreated with CD, latrunculin B (Lat B), or toxin B, or without drugs, incubated with Ad2 (30 μg/ml) in the cold, and analyzed for dex-FITC uptake 10 min p.i. Results are shown as fold stimulation normalized to noninfected, no drug–treated cells. (D) Stimulation of pinocytosis is integrin dependent. Ad2 (30 μg/ml) was bound to αv integrin–positive M21-L4 and αv integrin–negative M21 litter cells, and dex uptake was determined as above. (E) Ad2 binds specifically to both M21-L4 and M21 litter cells. 2.5 × 10⁶ cells were incubated with recombinant Ad2 fiber knob (0.4 μg/ml) in DME-F12 containing 0.2% BSA at 37°C for 30 min followed by incubation with [3H]thymidine Ad2 in cold RPMI-BSA for 60 min. 3H was determined by liquid scintillation counting. (F) PKC is required for fluid phase uptake stimulation. HeLa cells were pretreated with BIM, calphostin, Gö 6976, PKC-myr, or the control inhibitors autocamptide (autocampt) and KT5720, followed by Ad2 binding in the cold. BIM- and calphostin-treated cells were warmed in the presence of HRP for 15 min and processed for intracellular HRP analysis. The other cells were pulsed with dex-FITC as described above.
Figure 5.
Figure 5.
Ad2 induces membrane ruffles and macropinosomes. (A) Scanning EM of noninfected (a), Ad2-infected (b), and EGF-treated A431 cells (c). A431 cells were serum starved in DME-BSA for 14 h, incubated with Ad2 (30 μg/ml) or EGF (80 nM) in the cold for 1 h, and warmed in RPMI-BSA for 10 min (a and b) or 5 min (c), respectively. Bars, 10 μm. (B) Ad2-induced macropinosomes (arrows). Ad2 (20 μg/ml) was bound to HeLa cells in the cold and internalized for 5 min at 37°C, followed by a pulse with dex-FITC and SpDiIC-18 for 2 min. Cells were fixed in PFA and analyzed by CLSM. Noninfected cells were processed in parallel (d–f). Three merged consecutive sections are shown. Bar, 20 μm.
Figure 6.
Figure 6.
Macropinosomes in Ad2-infected A431 cells. Serum-starved A431 cells infected with Ad2 (A), treated with 80 nM EGF (B) or untreated (C) were observed by phase–contrast microscopy from 2 to 15 min after warming. Note the appearance and disappearance of macropinosomes, visible as bright spots in Ad2- and EGF-treated cells (arrows). Time stamps indicate h:min:sec. Bar, 10 μm. The complete data can be found in videos 1–3 available at http://www.jcb.org/cgi/content/full/jcb.200112067/DC1.
Figure 7.
Figure 7.
Inhibition of macropinocytosis by EIPA inhibits Ad2 escape from endosomes. (A) [35S]methionine-labeled Ad2 was internalized into EIPA-treated or untreated HeLa cells for different times followed by surface trypsinization (representative data from two independent experiments). (B) Thin section EM of incoming Ad2 in HeLa cells treated with EIPA (a) or without (b) 60 min p.i. Small arrows indicate extracellular virus, large arrows depict cytoplasmic Ad2, and arrowheads show Ad2 within coated vesicles. Bars, 200 nm. Quantification of Ad2 at the plasma membrane in intracellular vesicles, and in the cytosol of EIPA-treated (c) or untreated (d) HeLa cells. Viruses were scored in smooth (sh) and coated-pit (cp) regions of the plasma membrane (white bars), within small (s), medium (m), or large (l) endosomal vesicles (gray bars), and also in the cytosol (black bars), including the total (tot). Mean values are expressed as the percentage of total virus particles with corresponding SEM. n, Ad particles. (C) Nuclear targeting of Ad2-TR is blocked in EIPA-treated cells. HeLa cells were infected with Ad2-TR in the presence of tfn-488 for 50 min and chased for 10 min, fixed, and analyzed by CLSM. Projection of the entire optical stack for Ad2-TR and seven middle sections of tfn-488. Bar, 20 μm. (D) EIPA inhibits macropinocytosis stimulation. HeLa cells were pretreated with EIPA, bound with Ad2, pulsed with dex-FITC, and analyzed as in the legend to Fig. 4. See also Fig. S2 available at http://www.jcb.org/cgi/content/full/jcb.200112067/DC1.
Figure 8.
Figure 8.
Ad2-triggered release of macropinosomal contents into the cytosol. (A) HeLa cells with prebound Ad2 (a–c), ts1 (d–f), or no virus (g–i) were pulsed with NLS-BSA-FITC for 15 min, chased for 30 min, fixed, and analyzed by CLSM. Mean projections (NIH image) of all of the optical planes, single sections across the middle of the cells, and corresponding DIC images are shown. Bar, 20 μm. (B) Quantitative subcellular analysis of endocytosed NLS-BSA-FITC in Ad2, ts1, and noninfected cells. Results are shown as mean fluorescence intensities in the percentage of total cell-associated FITC fluorescence. n, number of cells. (C) Quantification of NLS-BSA-FITC–positive endosomes. Endosomes of each cell were determined in all of the optical sections, and results are displayed as mean values per cell. The complete data can be found in videos 3–6 available at http://www.jcb.org/cgi/content/full/jcb.200112067/DC1.
Figure 8.
Figure 8.
Ad2-triggered release of macropinosomal contents into the cytosol. (A) HeLa cells with prebound Ad2 (a–c), ts1 (d–f), or no virus (g–i) were pulsed with NLS-BSA-FITC for 15 min, chased for 30 min, fixed, and analyzed by CLSM. Mean projections (NIH image) of all of the optical planes, single sections across the middle of the cells, and corresponding DIC images are shown. Bar, 20 μm. (B) Quantitative subcellular analysis of endocytosed NLS-BSA-FITC in Ad2, ts1, and noninfected cells. Results are shown as mean fluorescence intensities in the percentage of total cell-associated FITC fluorescence. n, number of cells. (C) Quantification of NLS-BSA-FITC–positive endosomes. Endosomes of each cell were determined in all of the optical sections, and results are displayed as mean values per cell. The complete data can be found in videos 3–6 available at http://www.jcb.org/cgi/content/full/jcb.200112067/DC1.
Figure 9.
Figure 9.
Ad releases macropinosomal contents of K44A-dyn2–expressing cells, but EGF triggered macropinosomes remain largely intact. (A) Transiently transfected HeLa cells expressing K44A-dyn2 (identified by lack of tfn-488 uptake; not depicted) were pulsed with warm NLS-BSA-FITC with or without Ad2 and processed as described in the legend to Fig. 8. (B) A431 cells were pulsed with NLS-BSA-FITC with or without Ad2 (30 μg/ml) or EGF (33 nM) and processed as above. n, number of cells analyzed.
Figure 10.
Figure 10.
The presence of Ad particles in macropinosomes is not sufficient to elicit macropinosomal contents release. (A) K44A-dyn2–transfected and control HeLa cells were infected with 1 μg Ad per coverslip (a, b, e, and f) and 0.1 μg Ad per coverslip (c, d, g, and h) for 7 min, fixed, and analyzed by CLSM for subcellular Ad2-TR fluorescence (total projections in a–d and DIC images in e–h). Macropinosomes were identified by DIC optics, confirmed by filipin staining (not depicted), and marked by white tracings in one typical cell each (a–d). K44A-dyn2–expressing cells were identified by the absence of tfn–Alexa 495 staining (not depicted). Bar, 20 μm. (B) Quantification of Ad2-TR in macropinosomes. The amount of Ad2-TR fluorescence in macropinosomes and in nonmacropinosomal cell regions was determined using the MetaMorph software. The datasets were normalized per area. n, number of cells. Each cell contained several macropinosomes. (C) In a parallel experiment using Ad2, the amount of macropinosomal leakage was determined after a pulse of HeLa cells with NLS-BSA-FITC for 15 min followed by a 20-min chase in the absence of dye. K44A-dyn2–expressing cells were identified by the absence of tfn-rhodamine staining (not depicted). The datasets were normalized per area.

Similar articles

Cited by

References

    1. Abendroth, A., G. Morrow, A.L. Cunningham, and B. Slobedman. 2001. Varicella-zoster virus infection of human dendritic cells and transmission to T cells: implications for virus dissemination in the host. J. Virol. 75:6183–6192. - PMC - PubMed
    1. Aderem, A., and D.M. Underhill. 1999. Mechanisms of phagocytosis in macrophages. Annu. Rev. Immunol. 17:593–623. - PubMed
    1. Aktories, K. 1997. Rho proteins: targets for bacterial toxins. Trends Microbiol. 5:282–288. - PubMed
    1. Albert, M.L., J.I. Kim, and R.B. Birge. 2000. alphavbeta5 integrin recruits the CrkII-Dock180-rac1 complex for phagocytosis of apoptotic cells. Nat. Cell Biol. 2:899–905. - PubMed
    1. Amyere, M., B. Payrastre, U. Krause, P.V. Smissen, A. Veithen, and P.J. Courtoy. 2000. Constitutive macropinocytosis in oncogene-transformed fibroblasts depends on sequential permanent activation of phosphoinositide 3-kinase and phospholipase C. Mol. Biol. Cell. 11:3453–3467. - PMC - PubMed

Publication types

MeSH terms