. 2002 Sep;13(9):3218-34.
doi: 10.1091/mbc.e02-03-0134.

Regulation of airway tight junctions by proinflammatory cytokines

Affiliations

Regulation of airway tight junctions by proinflammatory cytokines

Carolyn B Coyne et al. Mol Biol Cell. 2002 Sep.

Abstract

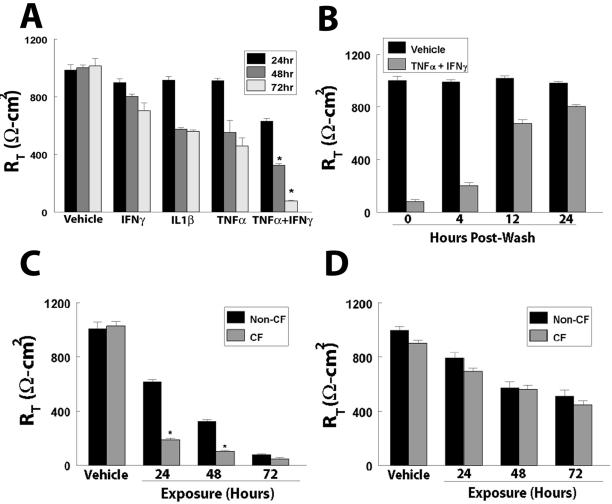
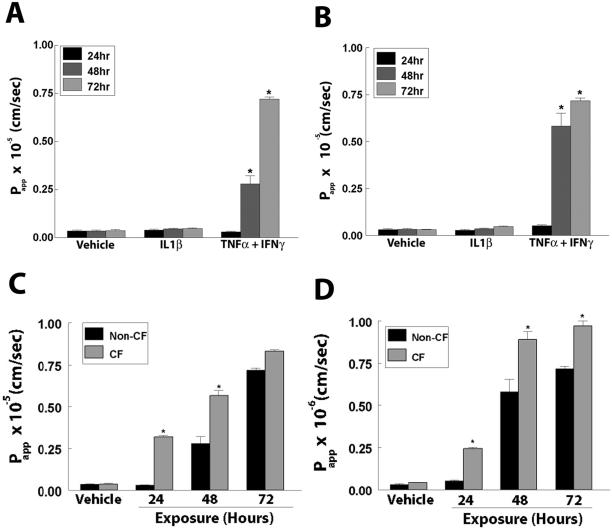
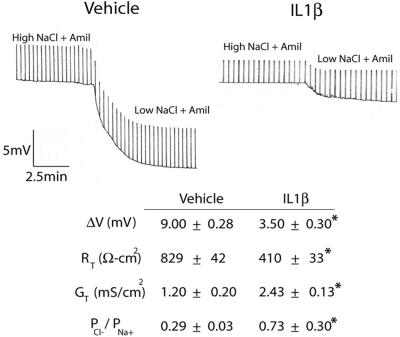
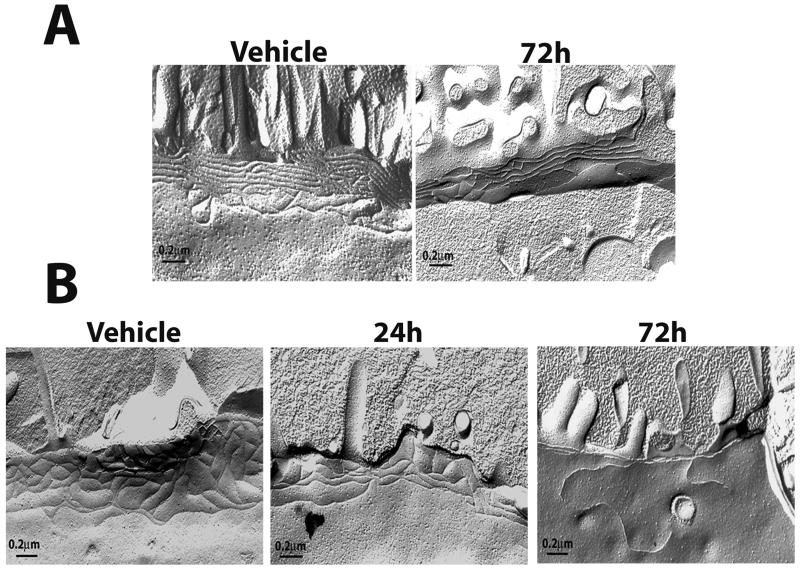
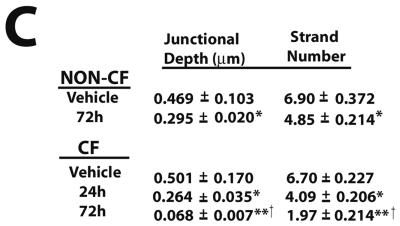
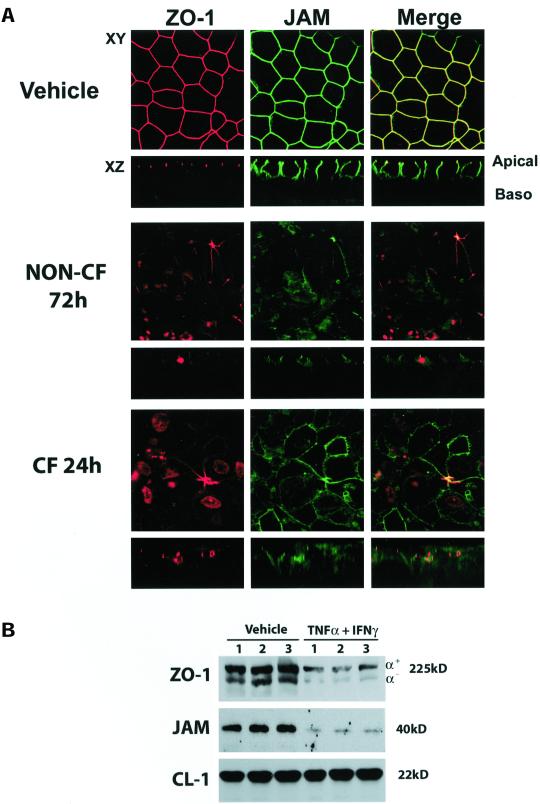
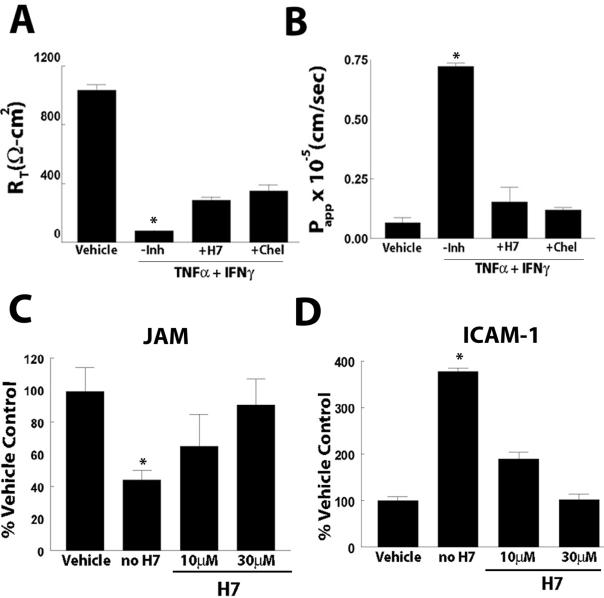
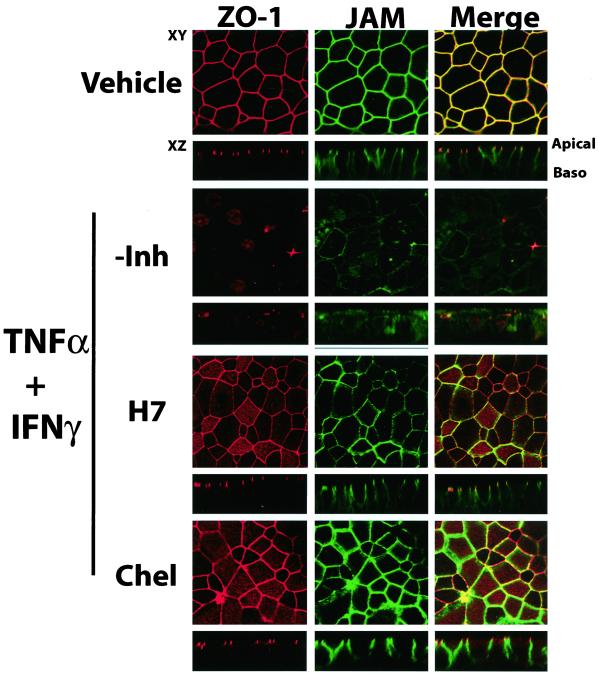
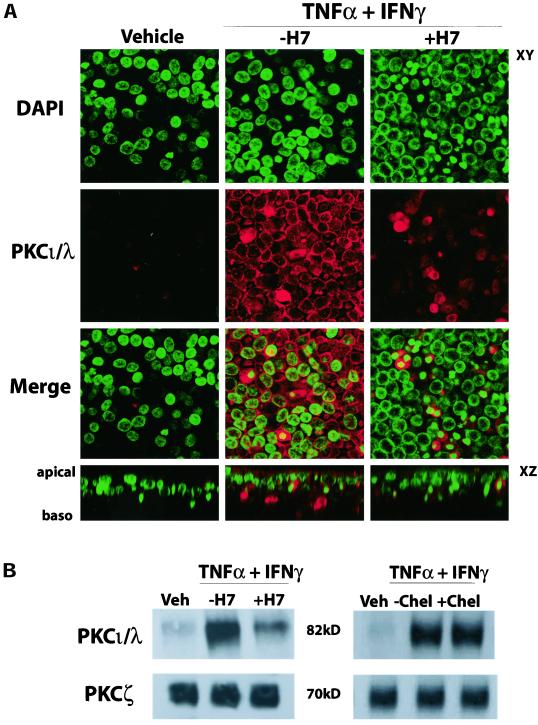
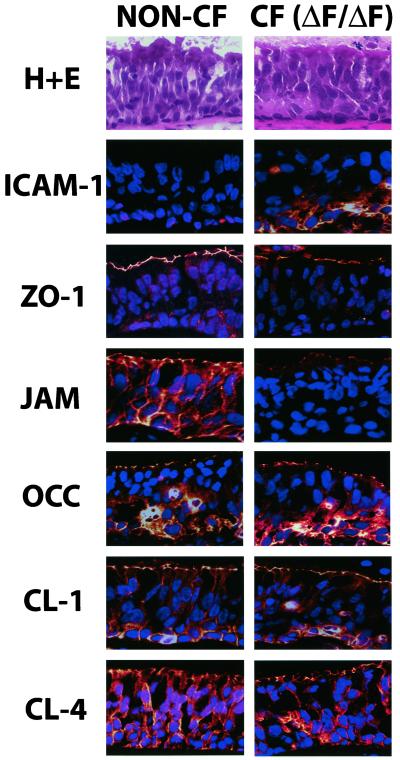
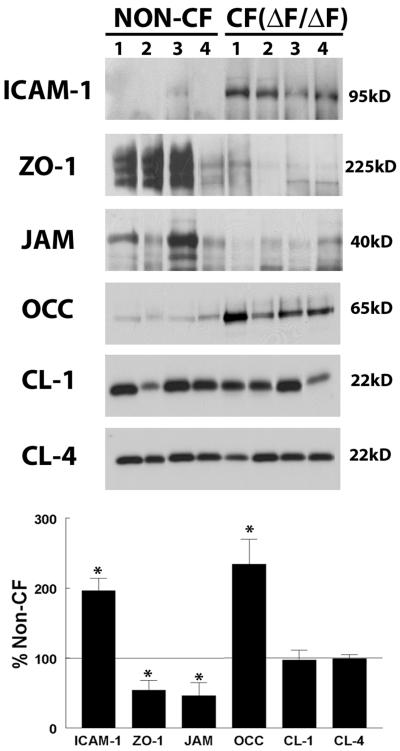
Epithelial tight junctions (TJs) provide an important route for passive electrolyte transport across airway epithelium and provide a barrier to the migration of toxic materials from the lumen to the interstitium. The possibility that TJ function may be perturbed by airway inflammation originated from studies reporting (1) increased levels of the proinflammatory cytokines interleukin-8 (IL-8), tumor necrosis factor alpha (TNF-alpha), interferon gamma (IFN-gamma), and IL-1beta in airway epithelia and secretions from cystic fibrosis (CF) patients and (2) abnormal TJ strands of CF airways as revealed by freeze-fracture electron microscopy. We measured the effects of cytokine exposure of CF and non-CF well-differentiated primary human airway epithelial cells on TJ properties, including transepithelial resistance, paracellular permeability to hydrophilic solutes, and the TJ proteins occludin, claudin-1, claudin-4, junctional adhesion molecule, and ZO-1. We found that whereas IL-1beta treatment led to alterations in TJ ion selectivity, combined treatment of TNF-alpha and IFN-gamma induced profound effects on TJ barrier function, which could be blocked by inhibitors of protein kinase C. CF bronchi in vivo exhibited the same pattern of expression of TJ-associated proteins as cultures exposed in vitro to prolonged exposure to TNF-alpha and IFN-gamma. These data indicate that the TJ of airway epithelia exposed to chronic inflammation may exhibit parallel changes in the barrier function to both solutes and ions.


Figures

Figure 1
Figure 1
Effect of cytokines on RT. (A) RT of non-CF WD primary HAE cells exposed to TNF-α, IFN-γ, or IL-1β alone, or TNF-α and IFN-γ in combination. (B) Recovery of RT after removal of TNF-α and IFN-γ at 4, 12, and 24 h after washing. (C) Effect of combined TNF-α and IFN-γ treatment on RT in non-CF and CF primary HAE cells. (D) Effect of IL-1β on RT in non-CF and CF primary HAE cells. *Significantly different from (A) vehicle and TNF-α, IFN-γ, or IL-1β alone or from (C) non-CF controls, at p < 0.001. Data presented are a minimum of n = 12 cultures from at least three patients.
Figure 2
Figure 2
Effect of cytokines on Papp. Papp to (A) 10-kDa or (B) 2000-kDa FITC-labeled dextran in WD primary HAE exposed to IL-1β alone or TNF-α and IFN-γ in combination for 24, 48, or 72 h. (C, D) Comparison of the effects of TNF-α and IFN-γ combined treatment on Papp in non-CF vs. CF WD primary HAE cells to (C) 10-kDa or (D) 2000-kDa FITC-labeled dextran. *Significantly different from vehicle (A, B) or from non-CF (C, D) controls at p < 0.05. Data presented are a minimum of n = 12 cultures from at least three patients.
Figure 3
Figure 3
Effect of IL-1β on relative ion selectivity. Polarized CF WD primary HAE cells were exposed to IL-1β for 72 h. Electrophysiological measurements and dilution potential (ΔVT) were measured and permeability ratio of Cl/Na+ (PCl−/PNa+) calculated as described in MATERIALS AND METHODS. Shown are the transepithelial voltage recordings with intermittent current pulses in amiloride (Amil)-treated cultures before and after luminal substitution with a low-NaCl solution. Current pulses and voltage scales are the same. Summary data are presented in the table. Data presented are representative of recordings from 12 cultures from 2 patients. *Significantly different from vehicle-treated controls.
Figure 4
Figure 4
Morphology of TJs of primary HAE cells exposed to TNF-α and IFN-γ. Freeze-fracture analysis of TJ strands of WD non-CF (A) or CF (B) HAE cells exposed to vehicle or cytokines for the indicated times. (C) Quantification of strand number and depth. Micrographs are representative of 40 μm (vehicle non-CF), 20 μm (vehicle CF), 70 μm (non-CF 72 h), 60 μm (CF 24 h), and 50 μm (CF 72 h) of TJ analyzed. Significantly different from vehicle controls (*), vehicle controls and 24 h exposure (**), and from non-CF 72 h (†) at p < 0.05.
Figure 4
Figure 4
Morphology of TJs of primary HAE cells exposed to TNF-α and IFN-γ. Freeze-fracture analysis of TJ strands of WD non-CF (A) or CF (B) HAE cells exposed to vehicle or cytokines for the indicated times. (C) Quantification of strand number and depth. Micrographs are representative of 40 μm (vehicle non-CF), 20 μm (vehicle CF), 70 μm (non-CF 72 h), 60 μm (CF 24 h), and 50 μm (CF 72 h) of TJ analyzed. Significantly different from vehicle controls (*), vehicle controls and 24 h exposure (**), and from non-CF 72 h (†) at p < 0.05.
Figure 5
Figure 5
Effect of TNF-α and IFN-γ treatment on expression and localization of JAM and ZO-1. (A) Immunofluorescent staining for JAM and ZO-1 in non-CF and CF primary HAE cells exposed to TNF-α and IFN-γ for 72 or 24 h. Red staining (left) represents ZO-1, green staining (middle) is JAM, and (right) merged image of both ZO-1 and JAM. Areas of colocalization appear as yellow. Images are representative of a minimum of n = 6 cultures from two patients. (B) Western blotting of ZO-1 (top) and immunoprecipitation of JAM (middle) in non-CF cultures. Western blot for ZO-1 was stripped and reprobed with an antibody specific for claudin-1 to control for loading (bottom).
Figure 6
Figure 6
TNF-α and IFN-γ effect on occludin, claudin-1, and claudin-4 distribution and expression. (A) Immunofluorescent staining for occludin and claudin-1 in primary HAE cells exposed to TNF-α and IFN-γ for 72 h. Occludin staining in green (middle), claudin-1 in red (left), and merged image (right). Colocalization appears as yellow. (B) Immunofluorescence staining of claudin-4 in vehicle-treated cultures and in cultures exposed to TNF-α and IFN-γ for 72 h. (C) Western blot analysis of occludin, claudin-1, and claudin-4. Top, Probed with an antibody recognizing both the HMW and LMW forms of occludin. This blot was then stripped and reprobed with an antibody recognizing only the LMW form of the protein. Claudin-1 and claudin-4 expression are below. Lanes 1–3, vehicle; 4–6, exposed to TNF-α and IFN-γ for 72 h. Images are representative of a minimum of n = 6 cultures from two patients.
Figure 7
Figure 7
Coordinate regulation of JAM and ICAM-1 in response to TNF-α and IFN-γ exposure. (A) JAM mRNA expression as determined by cQRT-PCR with an internal standard (ΔJAM) at the indicated concentration (1 to 0.0001 ng). Left, Vehicle, and right, cultures exposed to TNF-α and IFN-γ for 72 h. (B) Semiquantitative RT-PCR (QRT-PCR) analysis of ICAM-1 mRNA expression normalized to GAPDH. Top, ICAM-1 expression in vehicle or at 24, 48, or 72 h after exposure to TNF-α and IFN-γ. Bottom, GAPDH expression. (C, D) JAM (C) and ICAM-1 (D) protein expression determined by ELISA at 24, 48, and 72 h after exposure to TNF-α and IFN-γ. Data are from a minimum of n = 6 cultures from at least three patients.
Figure 8
Figure 8
Effect of selective and nonselective inhibitors of PKC on cytokine-induced changes in RT, Papp, and JAM and ICAM-1 expression. Cultures were exposed to TNF-α and IFN-γ in the presence or absence of H7 (nonselective) or chelerythrine chloride (selective) inhibitors of PKC. (A) RT and (B) Papp to 10-kDa FITC-dextran. JAM (C) and ICAM-1 (D) protein expression by ELISA in cultures treated with TNF-α and IFN-γ for 72 h in the absence or presence of 10 μM or 30 μM H7. *Significantly different from vehicle at p < 0.05. Data presented are a minimum of n = 12 cultures from at least three patients.
Figure 9
Figure 9
Effect of H7 and chelerythrine on the reorganization of ZO-1 and JAM. Immunofluorescent staining for JAM and ZO-1 in primary HAE cells exposed to TNF-α and IFN-γ for 72 h in the presence or absence of H7 (10 μM) or chelerythrine (10 μM). Red staining (left) represents ZO-1, green staining (middle) is JAM, and right is a merged image of both ZO-1 and JAM. Areas of colocalization appear yellow.
Figure 10
Figure 10
Cytokine effects on PKC isomer expression. WD primary HAEs were exposed to TNF-α and IFN-γ in the absence or presence of H7, and expression of PKCι/λ and PKCζ was determined. (A) Immunofluorescence localization of PKCι/λ after 72 h exposure to TNF-α and IFN-γ, with or without H7. Increased staining in cultures exposed to TNF-α and IFN-γ is evident. (B) Immunoprecipitation followed by Western blot analysis of PKCι/λ (top) and PKCζ (bottom) after 72 h exposure to TNF-α and IFN-γ, with or without H7 (left) or chelerythrine (right). Images and gel are representative of a minimum of n = 6 cultures from at least 3 patients.
Figure 11
Figure 11
In vivo localization of ICAM-1 and junctional components in freshly excised non-CF and CF (ΔF/ΔF) bronchus. Bronchi from non-CF and CF patients were isolated and prepared for staining as described in MATERIALS AND METHODS. Frozen sections were stained for ICAM-1, ZO-1, JAM, claudin-1, occludin, and claudin-4. Blue, DAPI-stained nuclei and red, positive protein staining. Images are representative of sections from a total of four patients of non-CF and CF (ΔF/ΔF) type each. Top, Hematoxylin and eosin (H+E) staining of a representative section of non-CF or CF type to illustrate section morphology.
Figure 12
Figure 12
In vivo expression of ICAM-1 and junctional components in non-CF and CF (ΔF/ΔF) freshly excised bronchus. Total protein isolated from the bronchi of non-CF and CF patients after transplant was subjected to Western blot analysis of ICAM-1 and TJ components as described in MATERIALS AND METHODS. Band intensity was analyzed and expression in CF patients presented as a percentage of non-CF (bottom). *Significantly different from non-CF (p < 0.05).

References

    1. Ahdieh M, Vandenbos T, Youakim A. Lung epithelial barrier function and wound healing are decreased by IL-4 and IL-13 and enhanced by IFN-gamma. Am J Physiol Cell Physiol. 2001;281:C2029–C2038. - PubMed
    1. Bonfield TL, Konstan MW, Berger M. Altered respiratory epithelial cell cytokine production in cystic fibrosis. J Allergy Clin Immunol. 1999;104:72–78. - PubMed
    1. Boucher RC. Human airway ion transport. Part one. Am J Respir Crit Care Med. 1994a;150:271–281. - PubMed
    1. Boucher RC. Human airway ion transport. Part two. Am J Respir Crit Care Med. 1994b;150:581–593. - PubMed
    1. Boucher RC, Stutts MJ, Knowles MR, Cantley L, Gatzy JT. Na+ transport in cystic fibrosis respiratory epithelia: abnormal basal rate and response to adenylate cyclase activation. J Clin Invest. 1986;78:1245–1252. - PMC - PubMed

Publication types

MeSH terms