. 2002 Sep;13(9):3257-67.
doi: 10.1091/mbc.e02-04-0231.

Agonist-induced PIP(2) hydrolysis inhibits cortical actin dynamics: regulation at a global but not at a micrometer scale

Affiliations

Agonist-induced PIP(2) hydrolysis inhibits cortical actin dynamics: regulation at a global but not at a micrometer scale

Jacco van Rheenen et al. Mol Biol Cell. 2002 Sep.

Abstract

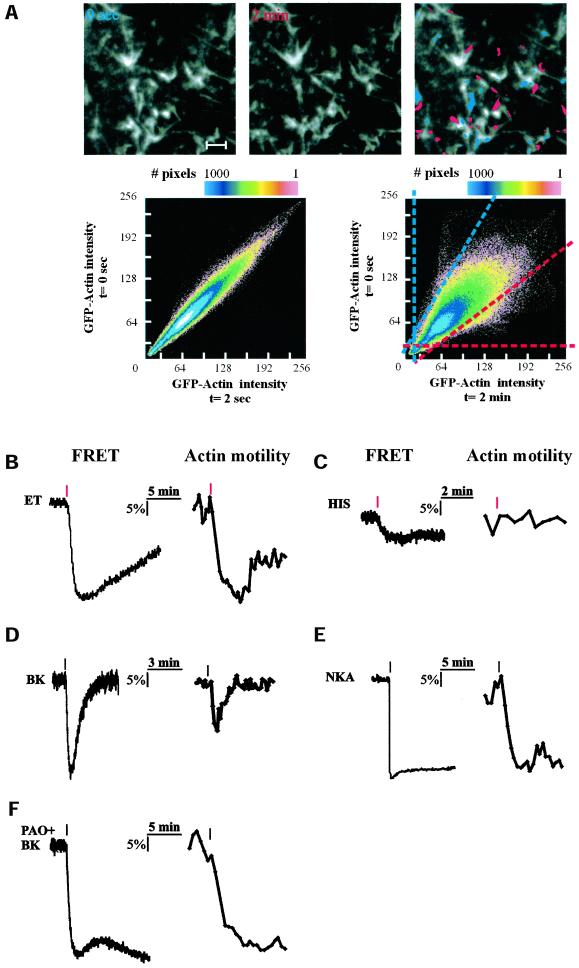
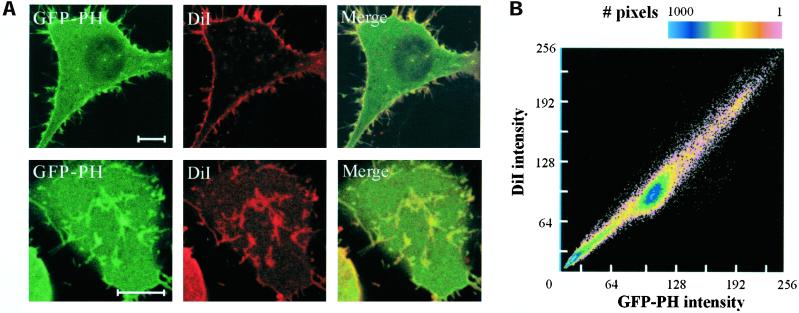
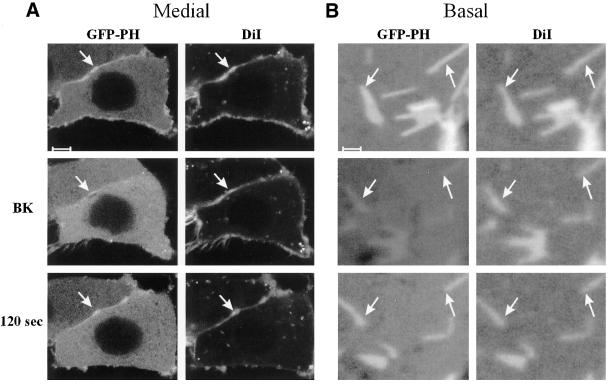
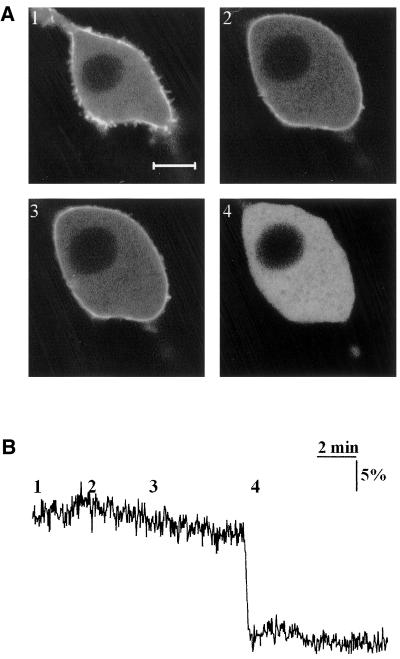
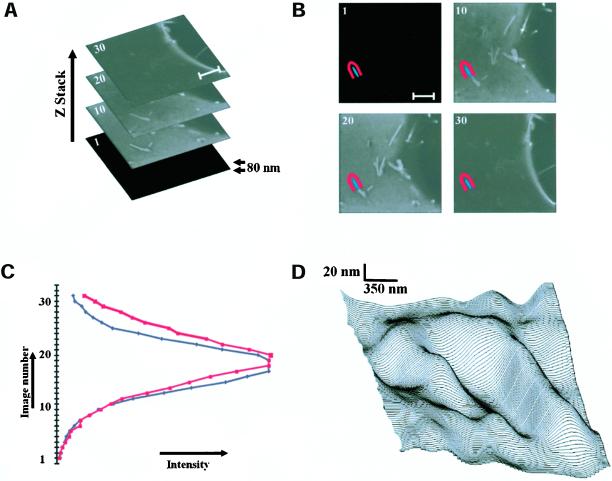
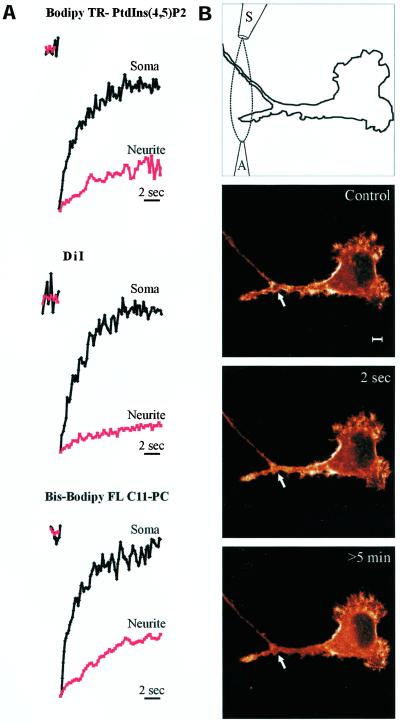
Phosphatidylinositol 4, 5-bisphosphate (PIP(2)) at the inner leaflet of the plasma membrane has been proposed to locally regulate the actin cytoskeleton. Indeed, recent studies that use GFP-tagged pleckstrin homology domains (GFP-PH) as fluorescent PIP(2) sensors suggest that this lipid is enriched in membrane microdomains. Here we report that this concept needs revision. Using three distinct fluorescent GFP-tagged pleckstrin homology domains, we show that highly mobile GFP-PH patches colocalize perfectly with various lipophilic membrane dyes and, hence, represent increased lipid content rather than PIP(2)-enriched microdomains. We show that bright patches are caused by submicroscopical folds and ruffles in the membrane that can be directly visualized at approximately 15 nm axial resolution with a novel numerically enhanced imaging method. F-actin motility is inhibited significantly by agonist-induced PIP(2) breakdown, and it resumes as soon as PIP(2) levels are back to normal. Thus, our data support a role for PIP(2) in the regulation of cortical actin, but they challenge a model in which spatial differences in PIP(2) regulation of the cytoskeleton exist at a micrometer scale.


Figures

Figure 1
Figure 1
Influence of agonist-induced PLC activation on cortical actin dynamics. (A) Detection of actin motility using intensity scatter plot. Time-lapse series of confocal images of the basal membrane of GFP-actin expressing N1E-115 cells were collected. For each pair of subsequent images X and Y, intensities of each pixel were plotted as dots in a (X, Y) scatterplot (see MATERIALS AND METHODS for further details). Multiple occurrence of identical coordinates is color-coded. For a pair of images collected 2 s apart, the scatterplot shows a distribution along the diagonal (left scatterplot), with some divergence due to the inherent photon noise. For pairs of images taken at longer time intervals (top panel, t = 0 and 2 min), bright actin structures that have moved in between collection of the images will be apparent as off-diagonal clusters of dots (right scatterplot). Dots within the blue-dashed area in this plot represent pixels of which the intensity has significantly decreased in 2 min; the red-dashed area contains all pixels whose intensity has increased after 2 min. Taking a fixed time interval (usually 30–120 s), actin motility as a function of time can be quantified extremely sensitively by calculating the fraction of pixels that are off-diagonal for subsequent images in a time-lapse series. In the composite (rightmost) photomicrograph, pixels from the dashed areas are superimposed on the image. Scale bar, 0.5 μm. (B–F) Comparison of agonist-induced PIP2 hydrolysis (left panels) and actin motility (right panels) in separate N1E-115 cells. Shown are responses from single cells (B) expressing the endothelin B receptor and stimulated with 20 nM endothelin (ET); (C) stimulated with 10 μM histamine (HIS); (D) stimulated with 1 μM bradykinin (BK); and (E) expressing a desensitization-defective neurokinin A receptor and stimulated with 1 μM neurokinin A (NKA) and (F) pretreated with 1 μM phenylarsine oxide (PAO) for 5 min and stimulated with 1 μM bradykinin (BK). Red marks indicate the moment of agonist addition.
Figure 2
Figure 2
Colocalization of GFP-PH and DiI. Living N1E-115 cells expressing GFP-PH were stained with the lipophilic membrane dye DiI. (A) Images of the fluorescent protein and DiI were collected from both medial (top panels) and basal (bottom panels) sections, using a confocal microscope. Scale bar, 5 μm. (B) Pixel intensity for DiI was plotted against GFP-PH intensity in a scatter plot. Note the difference from the scatter plots in Figure 1, where one fluorophore is imaged at two points in time.
Figure 3
Figure 3
Localization of GFP-PH and DiI during PIP2 hydrolysis. N1E-115 cells expressing GFP-PH were stained with DiI and imaged on the confocal microscope in medial (A) and basal (B) sections. Bradykinin (BK, 1 μM) induced PIP2 breakdown, resulting in translocation of GFP-PH. After resynthesis of PIP2 (at 120 s), GFP-PH returned to the membrane. In contrast, DiI patches (see arrow) remain at the membrane during PIP2 hydrolysis. Scale bar: (A) 5 μm, (B) 1 μm.
Figure 4
Figure 4
GFP-PH patches disappear after osmotic swelling. (A) Confocal images of NIH-3T3 cells expressing GFP-PH, subjected to hypotonic swelling. Osmolarity of the medium was adjusted from a basal value of 350 mOsmol (1) to 235 (2) and 120 mOsmol (3). Ionomycin, 5 μM, was added (4) to cause complete translocation of the fluorescent proteins. (B) PIP2 degradation was essayed by FRET in a single cell, subjected to the same protocol. Note that although swelling eliminates the patches, total PIP2 in the cell is virtually unaltered. Scale bar, 5 μm.
Figure 5
Figure 5
Direct visualization of subresolution membrane folds at the patches. (A) Stack of confocal XY-images, taken 80 nm apart in Z direction, showing the basal membrane of GFP-CAAX expressing N1E-115 cell. (B) Using image analysis software, an area was manually assigned within (blue) and just outside (red) a patch, and applied to the entire image stack. Scale bar, 2 μm. (C) Plotting the measured mean intensity within the blue and red area versus the image number in the stack reconstructs the axial pointspread function of the objective. The PSF (full-width at half-maximum) of the used Leica 63× oil 1.32 NA planapochromatic objective is 1.05 μm, at a confocal pinhole setting of 0.58 μm and at emission λ = 525 nm. By analysis of the offset of the normalized curves, the Z-position of the membrane can be estimated with high precision. (D) The three-dimensional surface profile of a patch is visualized with ∼15 nm resolution by applying this analysis on a point-by-point basis to the image stack.
Figure 6
Figure 6
Local PIP2 gradients are limited by diffusion. (A) Cells were labeled with DiI, bodipy-TR PtdIns(4,5)P2, or bis-bodipy-FL C11-phosphatidylcholine. Spots were bleached at the plasma membrane in neurites (red trace) or the soma (black trace) with a 0.2-s pulse of 488- or 568-nm laser light, and recovery was quantified from confocal images. Note that recovery upon spot photobleaching in neurites (red lines) was reduced by orders of magnitude. (B) N1E-115 cell expressing GFP-PH and a desensitization-defective NK2 receptor was imaged at the indicated time points using a confocal microscope. PLC was stimulated locally in a developing neurite by a precisely confined stream of neurokinin A (NKA) generated by means of an application (A) and a suction pipette (S). The resulting PIP2 degradation was monitored as GFP-PH translocation (see arrow). Similar results were obtained with bradykinin. The intensity of the images is color-coded with the “glow” color look-up table of Leica TCS software. Scale bar, 5 μm.

References

    1. Alblas J, van Etten I, Khanum A, Moolenaar WH. C-terminal truncation of the neurokinin-2 receptor causes enhanced and sustained agonist-induced signaling. Role of receptor phosphorylation in signal attenuation. J Biol Chem. 1995;270:8944–8951. - PubMed
    1. Andra K, Nikolic B, Stocher M, Drenckhahn D, Wiche G. Not just scaffolding: plectin regulates actin dynamics in cultured cells. Genes Dev. 1998;12:3442–3451. - PMC - PubMed
    1. Botelho RJ, Teruel M, Dierckman R, Anderson R, Wells A, York JD, Meyer T, Grinstein S. Localized biphasic changes in phosphatidylinositol-4,5-bisphosphate at sites of phagocytosis. J Cell Biol. 2000;151:1353–1368. - PMC - PubMed
    1. Brown FD, Rozelle AL, Yin HL, Balla T, Donaldson JG. Phosphatidylinositol 4,5-bisphosphate and Arf6-regulated membrane traffic. J Cell Biol. 2001;154:1007–1017. - PMC - PubMed
    1. Caroni P. New EMBO members'review. Actin cytoskeleton regulation through modulation of PI(4,5)P(2) rafts. EMBO J. 2001;20:4332–4336. - PMC - PubMed

Publication types

MeSH terms