. 2002 Sep 17;99(19):12287-92.
doi: 10.1073/pnas.172382999. Epub 2002 Sep 9.

Tumor necrosis factor-alpha regulation of CD4+CD25+ T cell levels in NOD mice

Affiliations

Tumor necrosis factor-alpha regulation of CD4+CD25+ T cell levels in NOD mice

Ava J Wu et al. Proc Natl Acad Sci U S A. .

Abstract

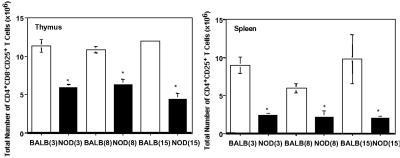
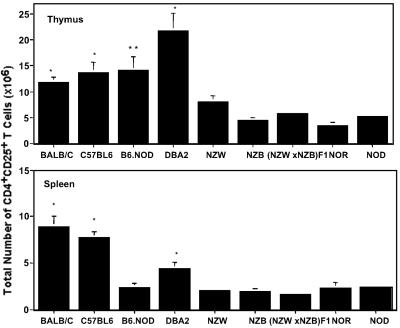
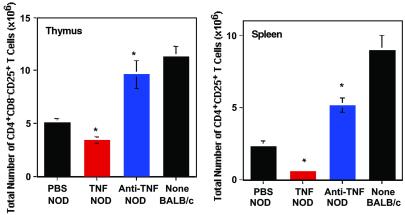
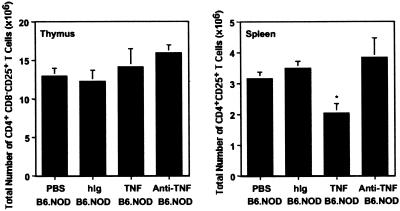
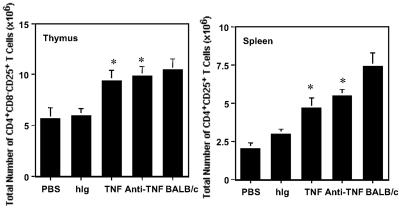
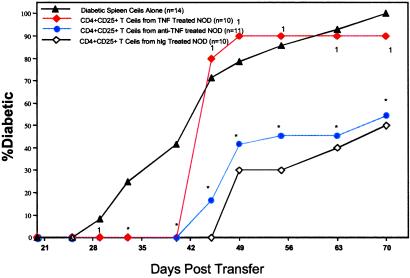
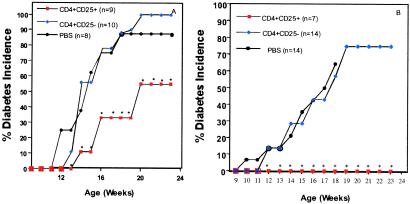
The mechanism by which tumor necrosis factor-alpha (TNF) differentially modulates type I diabetes mellitus in the nonobese diabetic (NOD) mouse is not well understood. CD4+CD25+ T cells have been implicated as mediators of self-tolerance. We show (i) NOD mice have a relative deficiency of CD4+CD25+ T cells in thymus and spleen; (ii) administration of TNF or anti-TNF to NOD mice can modulate levels of this population consistent with their observed differential age-dependent effects on diabetes in the NOD mouse; (iii) CD4+CD25+ T cells from NOD mice treated neonatally with TNF show compromised effector function in a transfer system, whereas those treated neonatally with anti-TNF show no alteration in ability to prevent diabetes; and (iv) repeated injection of CD4+CD25+ T cells into neonatal NOD mice delays diabetes onset for as long as supplementation occurred. These data suggest that alterations in the number and function of CD4+CD25+ T cells may be one mechanism by which TNF and anti-TNF modulate type I diabetes mellitus in NOD mice.


Figures

Fig 1.
Fig 1.
NOD mice have a decreased number of CD4+CD25+ T regulatory cells in spleen and thymus when compared directly to BALB/c mice. Each data point represents the mean of six mice per time point from at least two separate experiments. Filled bars, mean ± SEM of the number of CD4+CD25+ T cells in NOD mice. Empty bars, mean ± SEM of the number of CD4+CD25+ T cells from BALB/c mice. Significant differences in comparing NOD and BALB/c at 3, 8, and 15 weeks are noted with an asterisk. The age of the mouse is noted in parentheses.
Fig 2.
Fig 2.
Comparison of the CD4+CD25+ T regulatory population in the thymus and spleen of autoimmune prone and additional control mice. The relative number of CD4+CD25+ T regulatory cells for the designated mouse strain (see x axis label is displayed. The data are representative of the mean ± SEM from six mice and at least two separate experiments. All mice are female and 3–4 weeks of age. *, a statistically significant difference (P < 0.05) when compared with NZW, NZB, (NZBxNZW)F1, NOR, and NOD mice. **, a statistically significant difference (P < 0.05) when compared with NZB, (NZB×NZW)F1, NOR, and NOD mice.
Fig 3.
Fig 3.
Administration of TNF neonatally to NOD mice significantly decreases the CD4+CD25+ T regulatory cells in the thymus (Left) and spleen (Right), whereas neonatal administration of anti-TNF increases the CD4+CD25+ T regulatory population relative to control NOD mice. Effect of 1 μg of TNF (red) injected i.p. on alternate days for 3 weeks starting 1 day after birth on the number of CD4+CD25+ T regulatory cells in the thymus and spleen. Effect of 20 μg/g body weight of anti-TNF (blue; maximum dose of 100 μg) injected i.p. on alternate days for 3 weeks starting 1 day after birth on the number of CD4+CD25+ T regulatory cells in the thymus and spleen. The data are representative of the mean ± SEM of six mice from at least two separate experiments. Significant differences (P < 0.05) between PBS (and hIg) controls vs. treated mice are noted with an asterisk. Hamster Ig-treated mice were not significantly different from PBS-treated mice (data not shown). The mice are all female and 3–5 weeks of age.
Fig 4.
Fig 4.
Administration of TNF to neonatal B6.NOD mice decreases the number of CD4+CD25+ T cells in the spleen. Anti-TNF has no effect on the number of regulatory T cells in the thymus or spleen. TNF or anti-TNF was administered to neonatal B6.NOD mice as described in Fig. 3. The experimental groups are described on the x axis of the figure. The data represent the mean ± SEM of six mice from at least two separate experiments. Statistically significant differences (P < 0.05) between PBS-treated and TNF-treated mice are noted with an asterisk. The mice are all female and 3–4 weeks of age.
Fig 5.
Fig 5.
Administration of TNF or anti-TNF to the young adult NOD mouse significantly increases the number of CD4+CD25+ T regulatory cells in the thymus and spleen. Effect of i.p. injection of either 1 μg of TNF or 100 μg of anti-TNF every other day for 3 weeks on the total number of CD4+CD25+ T cells in thymus and spleen. The data are representative of the mean ± SEM from two experiments, each data point consisting of six mice. An asterisk indicates that there is a statistically significant increase in numbers of CD4+CD25+ T cells when compared with hIg- or PBS-treated NOD.
Fig 6.
Fig 6.
CD4+CD25+ T regulatory cells from NOD mice treated with TNF can delay the onset of diabetes, but are not as effective in preventing its onset as regulatory cells from NOD mice treated with anti-TNF or hIg. ▴, the percentage of diabetes in NOD.scid mice that had been injected with 107 + 200,000 diabetic spleen cells alone. Red ♦, 107 diabetic spleen cells + 200,000 CD4+CD25+ T cells from NOD mice treated neonatally with TNF. Blue •, 200,000 CD4+CD25+ T regulatory cells from anti-TNF-treated mice + 107 diabetic spleen cells. ⋄, 200,000 CD4+CD25+ T cells from hIg-treated mice + 107 diabetic spleen cells. All data points represent n = 10, except diabetic spleen cells alone (▴), which represents n = 14, and anti-TNF (•), which represents n = 11. Data from NOD.scid mice receiving the CD4+CD25 fraction are not shown, as the progression of diabetes in the NOD.scid mouse was not significantly different from those mice receiving spleen cells alone. Asterisk denotes a significant difference (P < 0.05) from NOD.scid mice receiving diabetic spleen cells alone (▴). A 1 denotes no significant difference from NOD.scid mice receiving diabetic spleen cells alone (▴). The data are representative of two independent experiments.
Fig 7.
Fig 7.
Injection (i.p.) of CD4+CD25+ T cells into neonatal NOD mice delays the onset of diabetes. (A) Percent diabetes in NOD mice injected intraperitoneally with 200,000 CD4+CD25+ or CD4+CD25 cells, once a week for 3 weeks or (B) NOD mice injected twice a week for 7 weeks and once a week for 9 weeks (weeks 1–3 were i.p. injections and weeks 4–16 were i.v. injections). •, the percentage of diabetes in NOD mice injected i.p. with PBS (carrier control). ▪, the percentage of diabetes in NOD mice injected i.p. with CD4+CD25+ T cells. ♦, the percentage of diabetes in NOD mice injected i.p. with CD4+CD25 T cells. The sample size is noted on the figure in parentheses.

References

    1. Sakaguchi S. (2000) Cell 101, 455-458. - PubMed
    1. Shevach E. (2001) J. Exp. Med. 193, F41-F45. - PMC - PubMed
    1. Salomon B., Lenschow, D. J., Rhee, L., Ashourian, N., Singh, B., Sharpe, A. & Bluestone, J. A. (2000) Immunity 12, 431-440. - PubMed
    1. Sakaguchi S., Sakaguchi, N., Asano, M., Itoh, M. & Toda, M. (1995) J. Immunol. 60, 1151-1164. - PubMed
    1. Suri-Payer E., Amar, A. Z., Thornton, A. M. & Shevach, E. (1998) J. Immunol. 60, 1212-1218. - PubMed

Publication types

MeSH terms

Substances