Comparative Study
. 2002 Sep;23(8):1369-77.

Brain abscess and necrotic brain tumor: discrimination with proton MR spectroscopy and diffusion-weighted imaging

Affiliations
Comparative Study

Brain abscess and necrotic brain tumor: discrimination with proton MR spectroscopy and diffusion-weighted imaging

Ping H Lai et al. AJNR Am J Neuroradiol. 2002 Sep.

Abstract

Background and purpose: Discriminating pyogenic brain abscesses from cystic or necrotic tumors is sometimes difficult with CT or MR imaging. We compared findings of proton MR spectroscopy ((1)H-MRS) with those of diffusion-weighted imaging to determine which technique was more effective for this differential diagnosis.

Methods: Fourteen patients (necrotic or cystic tumor [n = 7]; pyogenic abscess [n = 7]) who underwent 1.5-T (1)H-MRS and diffusion-weighted imaging and had findings of ring-shaped enhancement after contrast agent administration were enrolled in this study. Diffusion-weighted imaging was performed with a single-shot spin-echo echo-planar pulse sequence (b = 1000 s/mm(2)). The apparent diffusion coefficient and ratio were also measured.

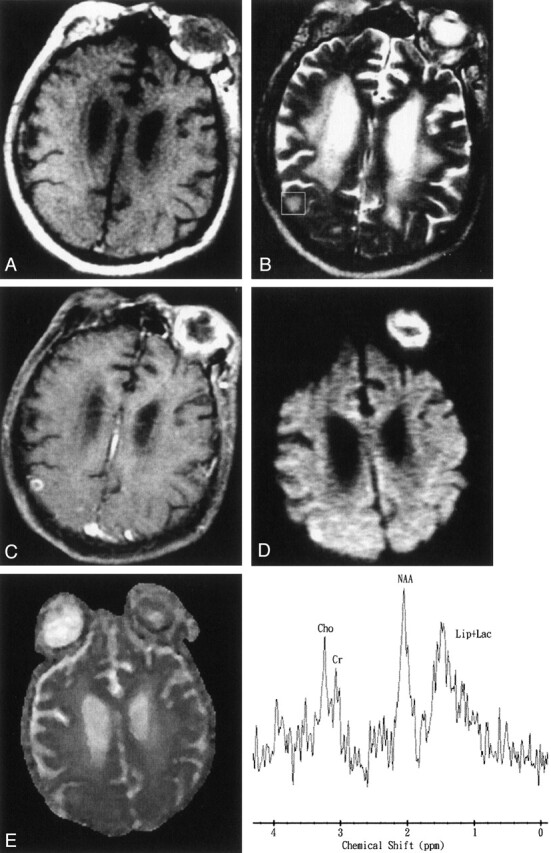
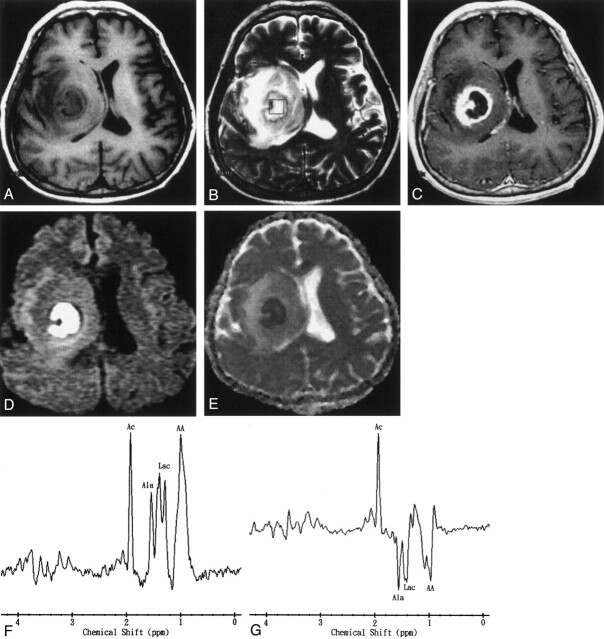
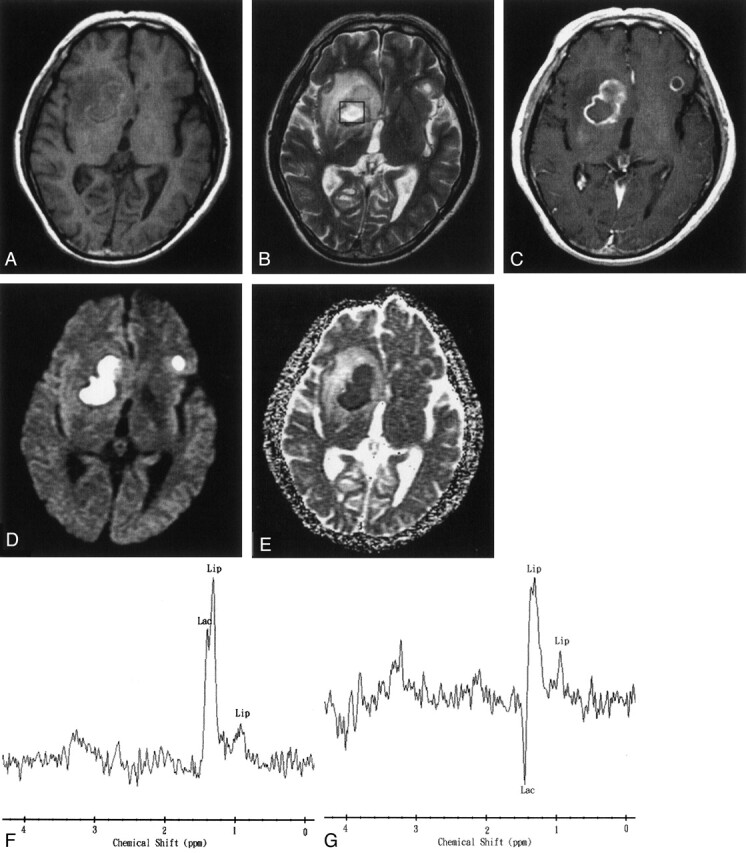
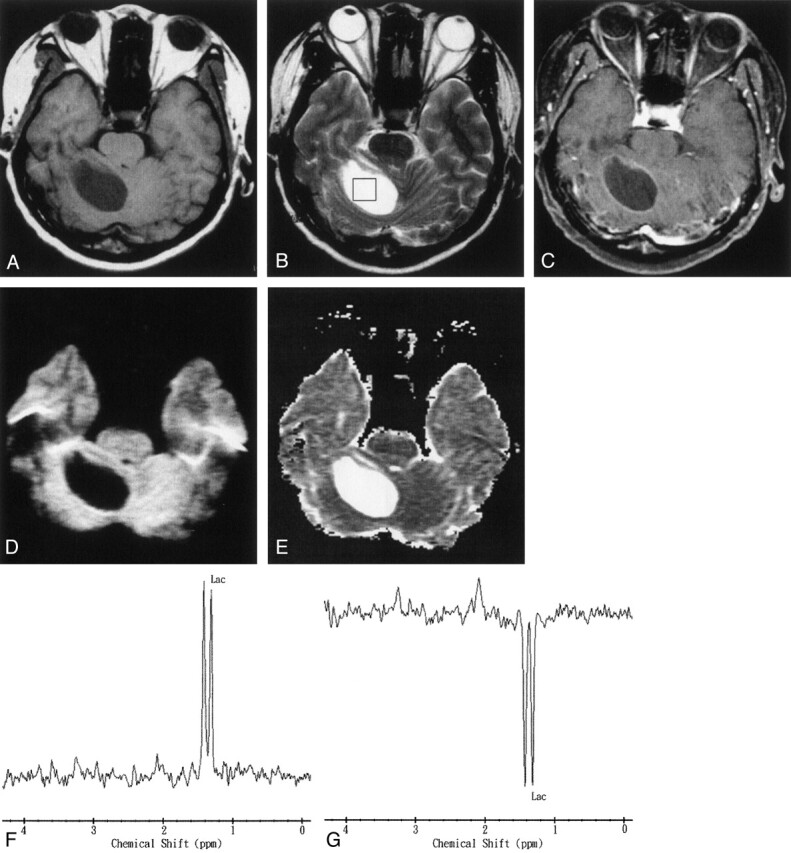
Results: Spectra for two patients were unacceptable because of either poor shimming conditions or contamination from neighboring fat. Spectra in three of five patients with abscess had lactate, amino acids (including valine, alanine, and leucine), and acetate peaks; one of the three spectra had an additional peak of succinate. In one patient with abscess treated by antibiotics, only lactate and lipid peaks were detected. Spectra for four of seven patients with cystic or necrotic tumors showed only lactate peaks. Lactate and lipids were found in three patients with tumors. Hyperintensity was seen in all the pyogenic abscess cavities and hypointensity in all the cystic and necrotic tumors on diffusion-weighted images.

Conclusion: (1)H-MRS and diffusion-weighted imaging are useful for differentiating brain abscess from brain tumor, but the latter requires less time and is more accurate than is (1)H-MRS. (1)H-MRS is probably more limited in cases of smaller peripheral lesions, skull base lesions, and treated abscesses.


Figures

F<sc>ig</sc> 1.
Fig 1.
Images obtained in a 69-year-old man with Klebsiella pneumoniae bacteremia, renal abscess, brain abscess, and endophthalmitis of the left eye. A, Axial T1-weighted image (500/30[TR/TE]) before administration of contrast material. B, Axial T2-weighted image (4000/100). The 2 × 2 × 2 cm voxel (box) in the lesion, adjacent brain tissue, and neighboring fat represents the 1H-MRS volume of interest. C, Axial contrast-enhanced T1-weighted MR image (500/30) shows a regular thin-walled ring-enhanced abscess approximately 9 mm in diameter in the superficial brain surface of right parietal region. Endophthalmitis in the left eye shows enhancement after contrast agent administration. D, Axial diffusion-weighted (10,000/93; b = 1000 s/mm2) image shows marked hyperintensity in the abscess cavity and the left eye. E, ADC map reveals slight hypointensity, representing restricted diffusion in the corresponding region. F, In vivo 1H-MR spectrum (2000/270) was unacceptable because of contamination from neighboring fat and a very small lesion. The resonances of choline (Cho), creatine (Cr), and N-acetylaspartate (NAA) were interpreted to be caused by partial volume effects of the adjacent brain tissue. A hump resonance (1–1.5 ppm) was identified, and lactate (Lac) peak contaminated by neighboring fat with a lipid (Lip) peak were suggested. Multiple small peaks at various frequencies are present; these peaks may represent noise or unassigned metabolites.
F<sc>ig</sc> 2.
Fig 2.
Images obtained in a 50-year-old man with surgically proven pyogenic brain abscess in the right basal ganglion. A, Axial T1-weighted image (500/30) before administration of contrast material. B, Axial T2-weighted image (4000/100). The 2 × 2 × 2 cm voxel (box) in the center of the lesion represents the 1H-MRS volume of interest. C, Axial contrast-enhanced T1-weighted (500/30) MR image shows a ring-shaped cystic lesion and surrounding edema. D, Axial diffusion-weighted (10,000/93; b = 1000 s/mm2) image shows marked hyperintensity in the abscess cavity and slight iso- to hypointensity surrounding the edema. E, ADC map reveals hypointensity in the abscess cavity, representing restricted diffusion, and hyperintense areas surrounding the edema. F and G, In vivo 1H spectra (2000/270 and 135) from the abscess cavity show resonances representing acetate (Ac), alanine (Ala), lactate (Lac), and amino acids (AA). At a TE of 135 (G), the phase reversal resonances are well depicted at 1.5, 1.3, and 0.9 ppm, which confirms the assignment to alanine, lactate, and amino acids, respectively.
F<sc>ig</sc> 3.
Fig 3.
Images obtained 35 days after the start of initial antibiotic treatment in a 45-year-old man with multiple pyogenic brain abscesses. A, Axial T1-weighted image (500/30) before administration of contrast material. B, Axial T2-weighted image (4000/100). The 2 × 2 × 2 cm voxel (box) represents 1H-MRS volume of interest. C, Axial contrast-enhanced T1-weighted (500/30) MR image shows two ring-shaped enhanced lesions in the right basal ganglion and left frontal lobe. D, Axial diffusion-weighted (10,000/93; b = 1000 s/mm2) image shows markedly high signal intensity in the abscess cavity and slightly iso- to hypointense surrounding edema. E, ADC map reveals low signal intensity in the abscess cavity, representing restricted diffusion, and hyperintense areas surrounding the edema. F and G, In vivo 1H spectra (2000/270 and 135) from the abscess cavity show a lactate (Lac) peak (1.3 ppm) that is inverted at a TE of 135 and a lipid (Lip) peak (0.8–1.2 ppm). Note the similarity of this spectral pattern to that of a necrotic brain tumor.
F<sc>ig</sc> 4.
Fig 4.
Images obtained in a 67-year-old man with a pathologically proven right cerebellar metastasis from primary lung adenocarcinoma. A, Axial T1-weighted image (500/30) before administration of contrast material. B, Axial T2-weighted image (4000/100). The 2 × 2 × 2 cm voxel (box) in the center of the lesion represents the 1H-MRS volume of interest. C, Axial contrast-enhanced T1-weighted (500/30) MR image shows a ring-enhanced lesion in the right cerebellum. D, Axial diffusion-weighted (10,000/93; b = 1000 s/mm2) image shows markedly low signal intensity in the necrotic part of the tumor. E, ADC map reveals high signal intensity in the necrotic part of the tumor that is similar to that of CSF, reflecting marked diffusion. F and G, In vivo 1H spectra (2000/270 and 135) from the necrotic center of the tumor show a lactate (Lac) peak at 1.3 ppm that is inverted at a TE of 135.

References

    1. Lau DW, Klein NC, Cunha BA. Brain abscess mimicking brain tumor. Heart Lung 1989;18:634–637 - PubMed
    1. Mamelak AN, Mampalam TJ, Obana WG, Rosenblum ML. Improved management of multiple brain abscesses: a combined surgical and medical approach. Neurosurgery 1995;36:76–85 - PubMed
    1. Demaerel P, Van Hecke P, Van Oostende S, et al. Bacterial metabolism shown by magnetic resonance spectroscopy. Lancet 1994;344:1234–1235 - PubMed
    1. Harada M, Tanouchi M, Miyoshi H, Nishitani H, Kannuki S. Brain abscess observed by localized proton magnetic resonance spectroscopy. Magn Reson Imaging 1994;12:1269–1274 - PubMed
    1. Remy C, Grand S, Lai ES, et al. 1H MRS of human brain abscess in vivo and in vitro. Magn Reson Med 1995;34:508–514 - PubMed

Publication types