

Comparing smooth arm movements with the two-thirds power law and the related segmented-control hypothesis
- PMID: 12223574
- PMCID: PMC6758108
- DOI: 10.1523/JNEUROSCI.22-18-08201.2002
Comparing smooth arm movements with the two-thirds power law and the related segmented-control hypothesis
Abstract
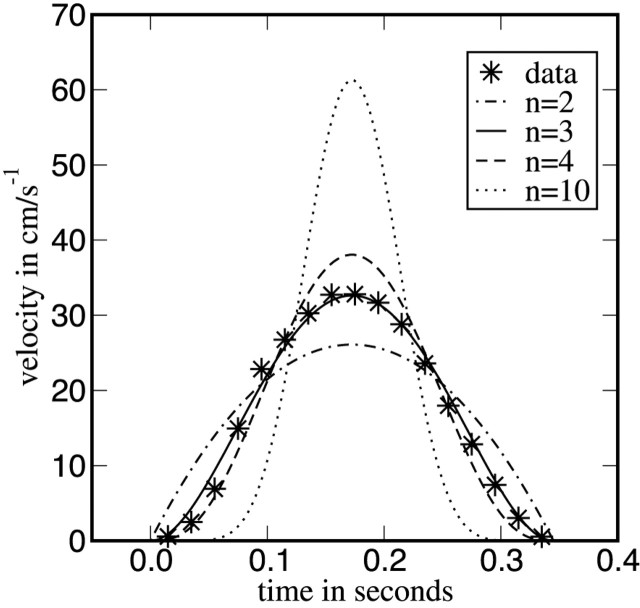
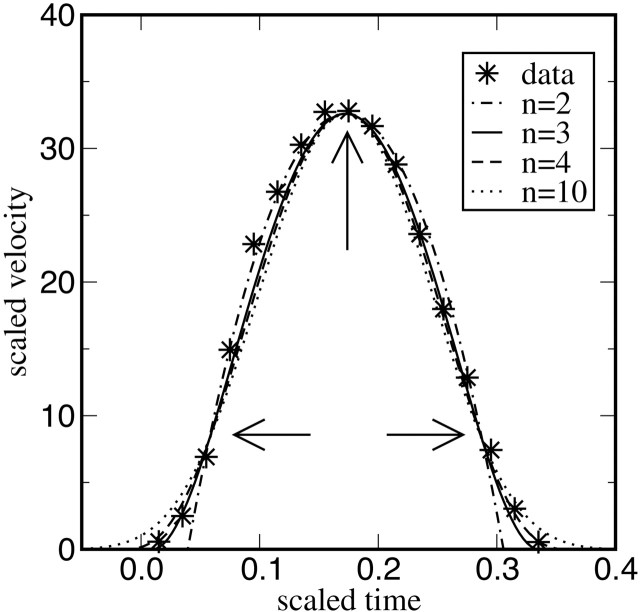
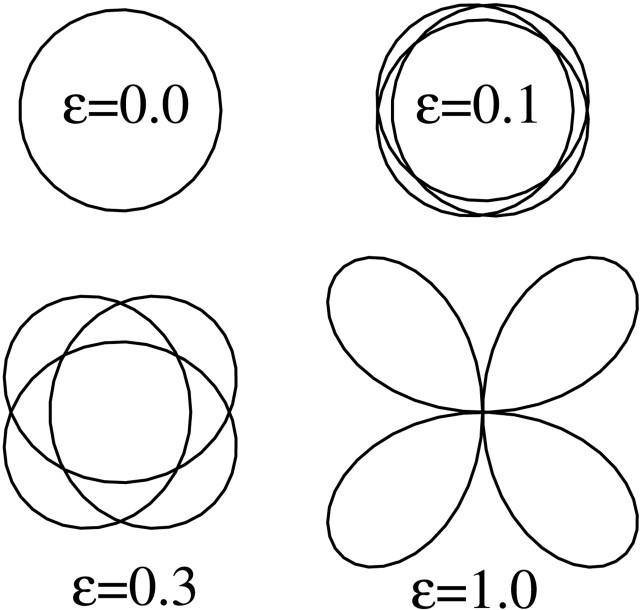
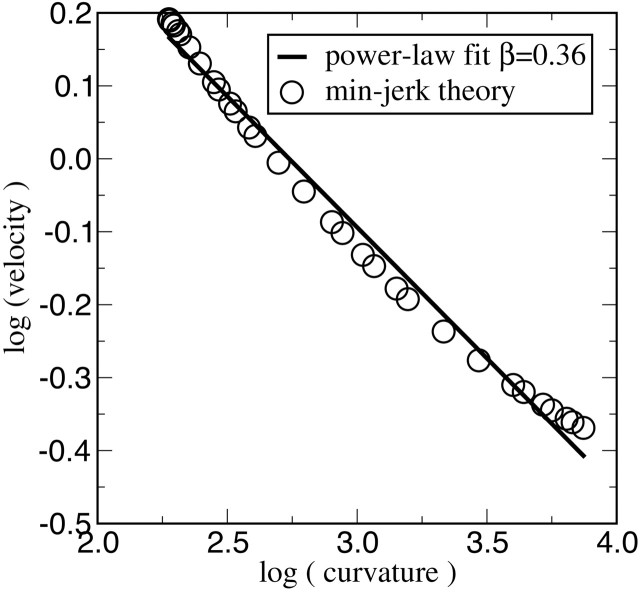
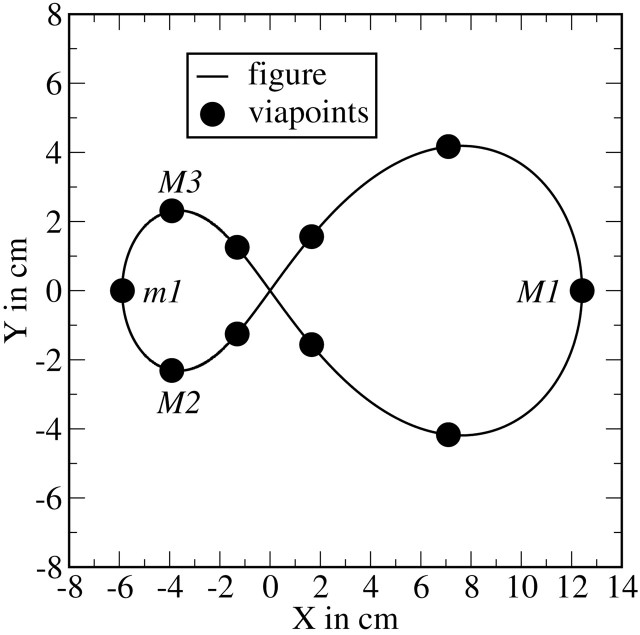
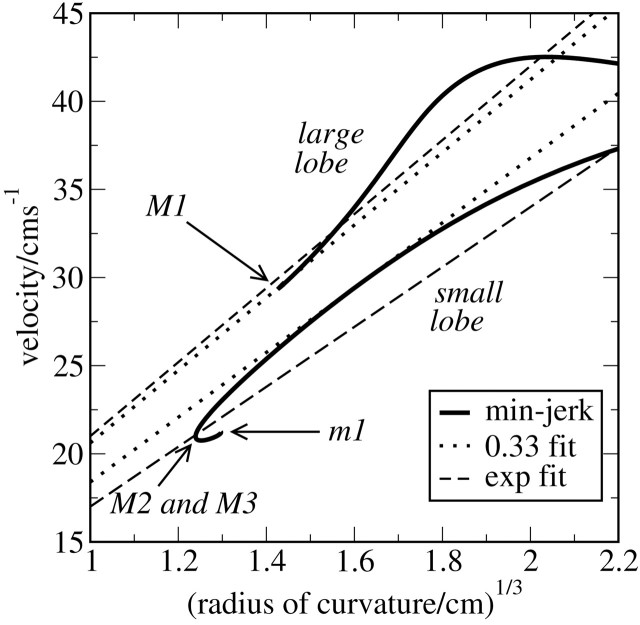
The movements of the human arm have been extensively studied for a variety of goal-directed experimental tasks. Analyses of the trajectory and velocity of the arm have led to many hypotheses for the planning strategies that the CNS might use. One family of control hypotheses, including minimum jerk, snap and their generalizations to higher orders, comprises those that favor smooth movements through the optimization of an integral cost function. The predictions of each order of this family are examined for two standard experimental tasks: point-to-point movements and the periodic tracing of figural forms, and compared both with experiment and the two-thirds power law. The aim of the analyses is to generalize previous numerical observations as well as to examine movement segmentation. It is first shown that contrary to recent statements in the literature, the only members of this family of control theories that match reaching movement experiments well are minimum jerk and snap. Then, for the case of periodic drawing, both the ellipse and cloverleaf are examined and the experimentally observed power law is derived from a first-principles approach. The results for the ellipse are particularly general, representing a unification of the two-thirds power law and smoothness hypotheses for ellipses of all reasonable eccentricities. For complex shapes it is shown that velocity profiles derived from the cost-function approach exhibit the same experimental features that were interpreted as segmented control by the CNS. Because the cost function contains no explicit segmented control, this result casts doubt on such an interpretation of the experimental data.
Figures
References
-
- Doeringer JA, Hogan N. Serial processing in human movement production. Neural Networks. 1998;11:1345–1356. - PubMed
-
- Flash T. The control of hand equilibrium trajectories in multi-joint arm movements. Biol Cybern. 1987;57:257–274. - PubMed
-
- Gribble PL, Ostry DJ. Origin of the power law relation between movement velocity and curvature: modelling the effects of muscle mechanics and limb dynamics. J Neurophysiol. 1996;76:2853–2860. - PubMed
Publication types
MeSH terms
LinkOut - more resources
Full Text Sources
Other Literature Sources