Comparative Study
. 2002 Aug 29;3(9):research0045.
doi: 10.1186/gb-2002-3-9-research0045. Epub 2002 Aug 29.

Gene-expression profile comparisons distinguish seven organs of maize

Affiliations
Comparative Study

Gene-expression profile comparisons distinguish seven organs of maize

Yangrae Cho et al. Genome Biol. .

Abstract

Background: A maize array was fabricated with 5,376 unique expressed sequence tag (EST) clones sequenced from 4-day-old roots, immature ears and adult organ cDNA libraries. To elucidate organ relationships, relative mRNA levels were quantified by hybridization with embryos, three maize vegetative organs (leaf blades, leaf sheaths and roots) from multiple developmental stages, husk leaves and two types of floral organs (immature ears and silks).

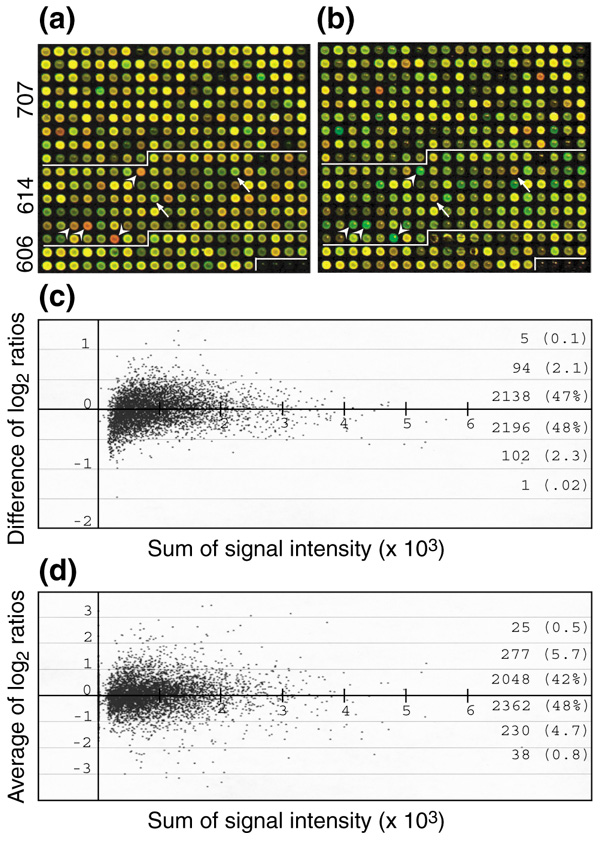
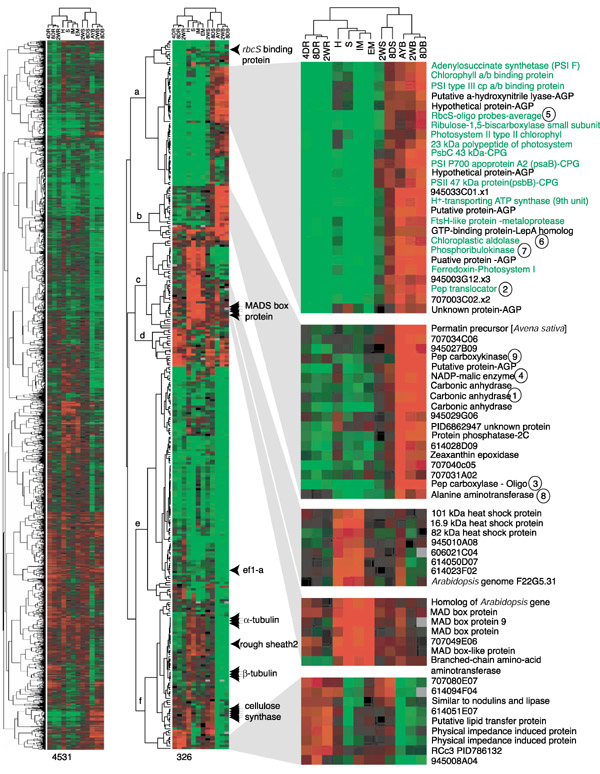
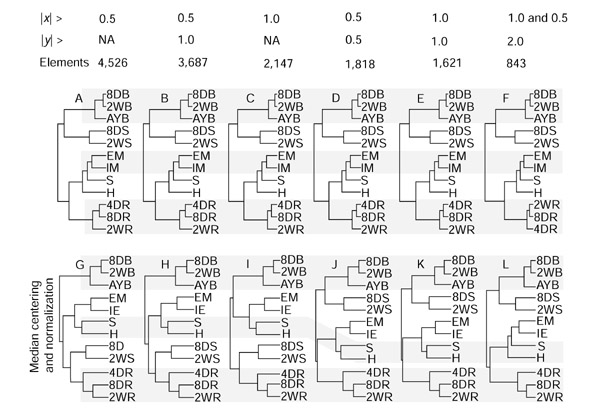
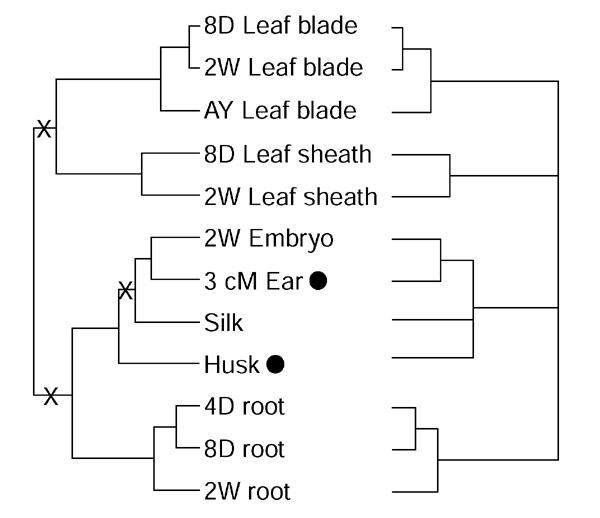
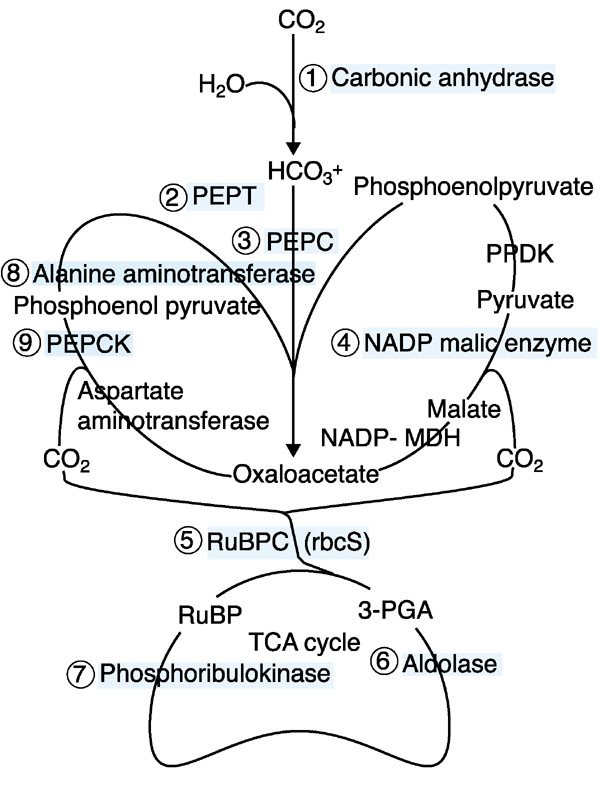
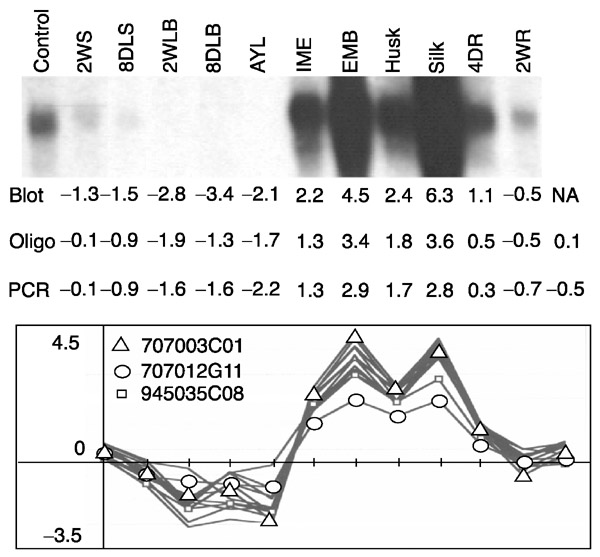
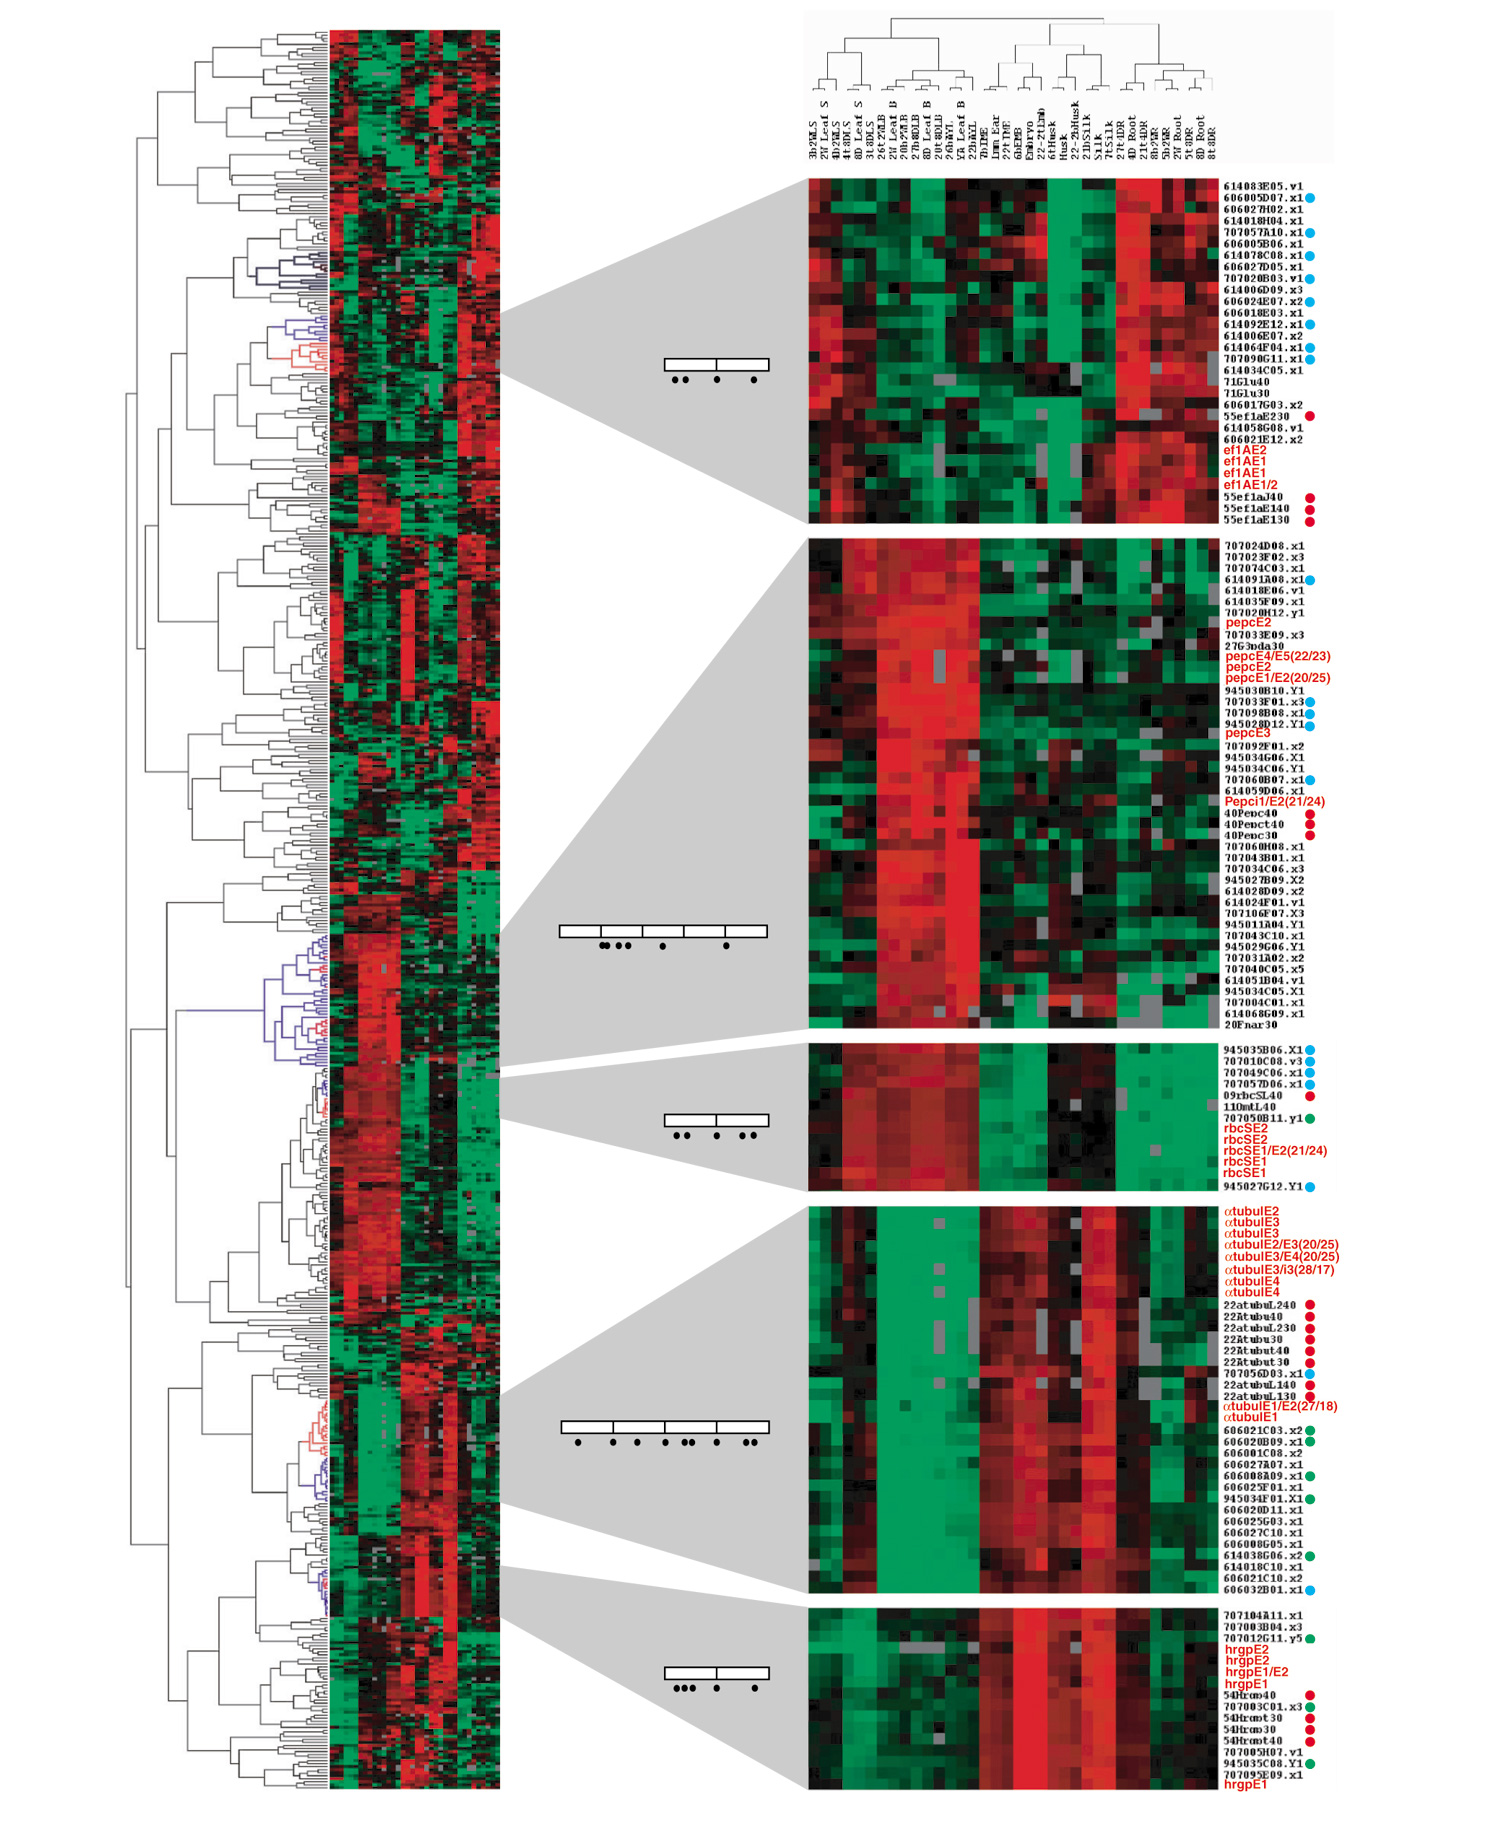
Results: Clustering analyses of the hybridization data suggest that maize utilizes both the PEPCK and NADP-ME C(4) photosynthetic routes as genes in these pathways are co-regulated. Husk RNA has a gene-expression profile more similar to floral organs than to vegetative leaves. Only 7% of the genes were highly organ specific, showing over a fourfold difference in at least one of 12 comparisons and 37% showed a two- to fourfold difference. The majority of genes were expressed in diverse organs with little difference in transcript levels. Cross-hybridization among closely related genes within multigene families could obscure tissue specificity. As a first step in elucidating individual gene-expression patterns, we show that 45-nucleotide oligo probes produce signal intensities and signal ratios comparable to PCR probes on the same matrix.

Conclusions: Gene-expression profile studies with cDNA microarrays provide a new molecular tool for defining plant organs and their relationships and for discovering new biological processes in silico. cDNA microarrays are insufficient for differentiating recently duplicated genes. Gene-specific oligo probes printed along with cDNA probes can query individual gene-expression profiles and gene families simultaneously.


Figures

Figure 1
Figure 1
Dye-swap hybridization experiment. (a,b) Dye-swap hybridization protocol on microarrays fabricated with cDNAs from EST projects 606 (immature ear, IME), 614 (4-day seedling roots, 4DR), and 707+945 (mixture of adult tissues). Each image was obtained from co-hybridization of two dye-labeled targets on a single microarray. Two false-color images were superimposed to represent the relative amount of transcripts in the samples. (a) IME labeled with Cy3 (green) and 4DR with Cy5 (red); (b) samples labeled reciprocally. Arrows and arrowheads in (a) and (b) indicate a few obvious examples of organ-specific expression (see (d)). (c) Consistency of hybridization was examined by calculating signal-ratio differences from the dye-swapping experiment for each microarray element. Log2 signal ratios of 4DR over IME were calculated from each hybridization, followed by subtraction of the log2 ratios from slide (a) by those on slide (b). (d) Relative transcript abundances in the two samples were plotted against the sum of signal intensities from both channels. Log2 signal ratios of 4DR over IME were averaged from the dye-swap experiment. Difference of log2 ratio and average of log2 ratio are given by [log2(4DR/IME)a]/ [log2(4DR/IME)b] and [log2(4DR/IME)a + log2(4DR/IME)b]/2, respectively.
Figure 2
Figure 2
Gene-expression cladograms showing the relative abundance of transcripts in 13 samples. The left cladogram was constructed with 4,531 elements, and the right one with 326 elements. The 326 elements exhibit >4-fold ratio difference in at least one of 12 comparisons. Trees at the left side of the cladogram present gene relationships, and the trees on the top of cladogram show organ relationships. Color codes and color ratios in each panel are: the brightest red is >4-fold higher, the brightest green is >4-fold lower, and black is same ratio in that comparison. Green colored names mark genes whose gene products are located in chloroplasts. Circled numbers match the numbers in Figure 5 which shows the place of these enzymes in the C4 photosynthetic pathways. Multiple genes in each gene family are marked with arrows, and other genes discussed in the text are marked with arrowheads. Numbers indicate Stanford identification numbers for individual EST clones. For the complete list of genes see Additional data files.
Figure 3
Figure 3
Organ relationships derived from gene-expression profiles. Each tree was constructed using Cluster [32] with various numbers of elements, selected on the basis of three criteria as shown at the top. |x| > indicates the absolute log2 ratio of each hybridization for a given element, and |y| > indicates absolute value of difference between maximum and minimum log2 ratios among 13 hybridizations. Elements indicate the numbers of probes that were selected by the given criteria, and then used to construct the trees in the column below. Trees A-F were constructed using the signal-ratio data without a secondary normalization process. Trees G-L were constructed with the same elements as the panel immediately above after a median centering and a normalization process. Results were indistinguishable between hybridization success rates of 80% and 50%; the diagrams shown are from the analysis of 80% of the data. A gray bar marks the same set of tissues. 8DB, 8-day leaf blade; 2WB, 2-week leaf blade; AYB, adult leaf blade; 8DS, 8-day leaf sheath; 2WS, 2-week leaf sheath; EM, embryo; IM, immature ear; S, silk; H, husk; 4DR, 4-day root; 8DR, 8-day root; 2WR, 2-week root; NA, not applicable.
Figure 4
Figure 4
A consensus tissue tree based on the profiles shown in Figure 3. The left-hand tree is identical to B in Figure 3, and the right-hand tree is a majority consensus tree from the 14 analyses. X, internodes that are not consistent among the majority of the 14 trees.
Figure 5
Figure 5
Proposed C4 pathways in maize. CO2 fixation genes on the cladogram of Figure 2 are mapped onto the biochemical pathway. NADP-MDH, NADP-malate dehydrogenase; PEPC, phosphoenolpyruate carboxylase; PEPCK, phosphoenolpyruvate carboxykinase; PEPT, PEP transferase; PPDK, pyruvate orthophosphate dikinase; RuBPC, Rubisco.
Figure 6
Figure 6
Signal-ratio comparisons between RNA blot and microarray hybridizations for oligos and the corresponding PCR products. Maize RNA samples were prepared from multiple tissues and probed with a hrgp cDNA clone. The blot ratios were calculated from the signal intensity of each lane divided by the signal intensity of the control lane. Signal ratios for individual probes were calculated from microarray hybridization. All calculations are presented as log2 ratios. Tissue abbreviations as in Figure 3.
Figure 7
Figure 7
Gene-expression cladogram comparing hybridization patterns of oligos and PCR probes. 582 of 5,760 probes were selected for the analyses on the basis of hybridization success rate (>80%), absolute signal ratio (|log2 ratio| > 2 in a minimum of 1 of 24 pairs of hybridizations, and mean of duplicate hybridizations) and ratio difference (max|log2 ratio| - min|log2 ratio| > 2). Red terminal branches (in the cladogram on left) mark where oligo probes are distributed in each section. Blue branches mark the common terminal branches, which include all oligo probes and one or more related PCR probes. Oligos of 45 nucleotides are in red, and 30-nucleotide and 40-nucleotide oligos are marked with red dots beside each name; the corresponding cDNA probes are marked with green dots, and functionally related genes (according to annotations) with blue dots. Most other genes with EST numbers have not yet been assigned specific functions. Open boxes within gene diagrams represent exons and bars inside each box represent splicing junctions. Black dots depict the positions of oligo probes. The color code represents the relative mRNA amounts: red is high, green is low, and black is similar to the reference sample.

References

    1. Jack T. Plant development going MADS. Plant Mol Biol. 2001;46:515–520. - PubMed
    1. The Arabidopsis Genome Initiative Analysis of the genome sequence of the flowering plant Arabidopsis thaliana. Nature. 2000;408:796–815. doi: 10.1038/35048692. - DOI - PubMed
    1. Schena M, Shalon D, Davis RW, Brown PO. Quantitative monitoring of gene-expression patterns with a complementary-DNA microarray. Science. 1995;270:467–470. - PubMed
    1. Schena M, Shalon D, Heller R, Chai A, Brown PO, Davis RW. Parallel human genome analysis: microarray-based expression monitoring of 1000 genes. Proc Natl Acad Sci USA. 1996;93:10614–10619. - PMC - PubMed
    1. DeRisi JL, Iyer VR, Brown PO. Exploring the metabolic and genetic control of gene expression on a genomic scale. Science. 1997;278:680–686. - PubMed

Publication types

MeSH terms