. 2002 Aug 30;3(9):research0048.
doi: 10.1186/gb-2002-3-9-research0048. Epub 2002 Aug 30.

A new non-linear normalization method for reducing variability in DNA microarray experiments

Affiliations

A new non-linear normalization method for reducing variability in DNA microarray experiments

Christopher Workman et al. Genome Biol. .

Abstract

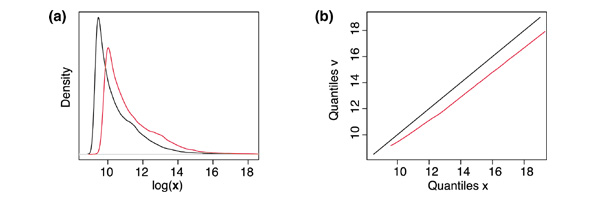
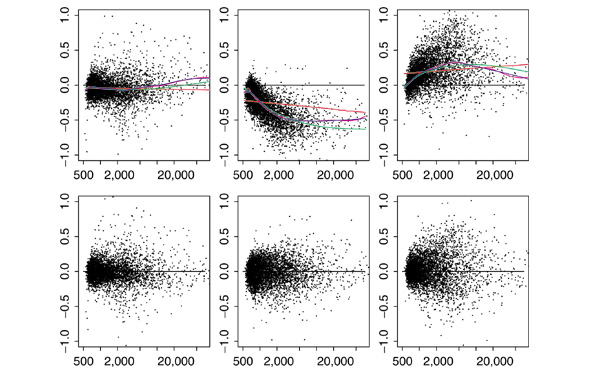
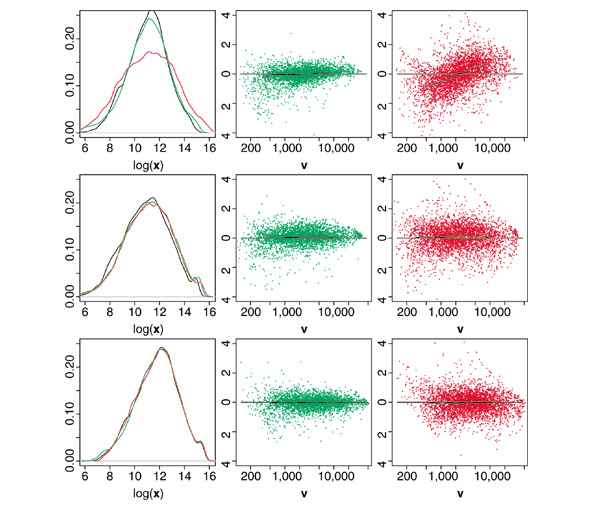
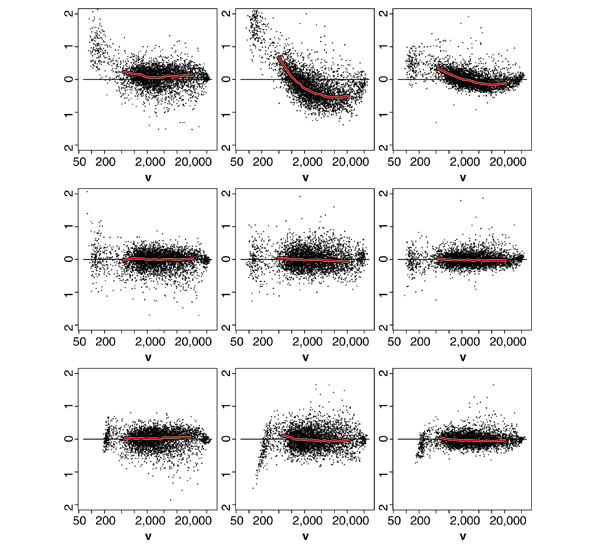
Background: Microarray data are subject to multiple sources of variation, of which biological sources are of interest whereas most others are only confounding. Recent work has identified systematic sources of variation that are intensity-dependent and non-linear in nature. Systematic sources of variation are not limited to the differing properties of the cyanine dyes Cy(5) and Cy(3) as observed in cDNA arrays, but are the general case for both oligonucleotide microarray (Affymetrix GeneChips) and cDNA microarray data. Current normalization techniques are most often linear and therefore not capable of fully correcting for these effects.

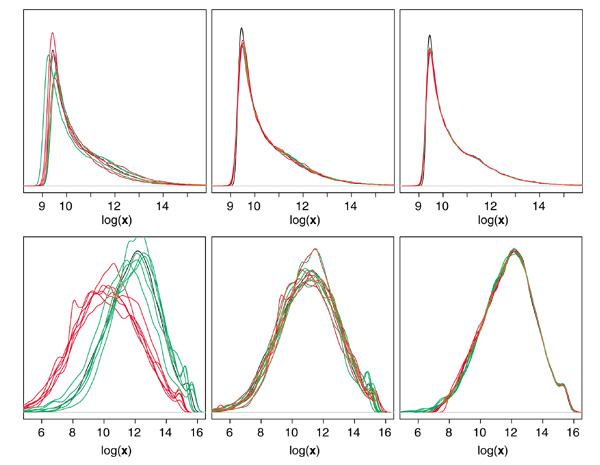
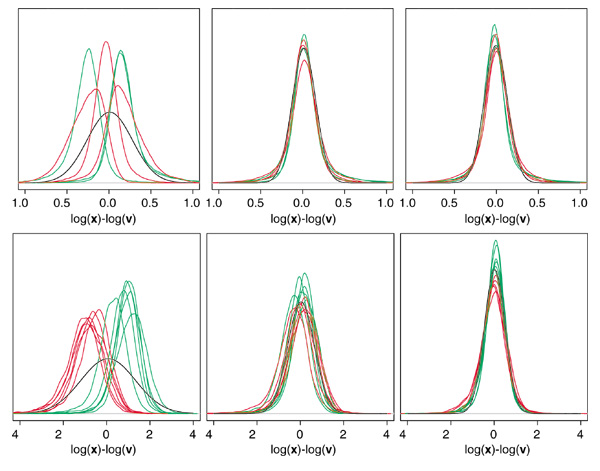
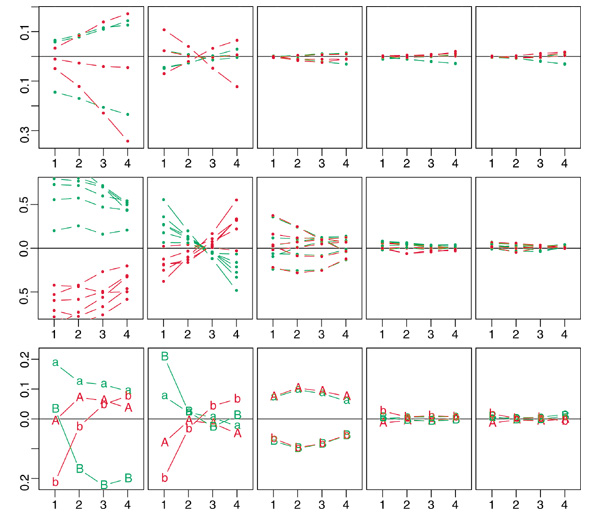
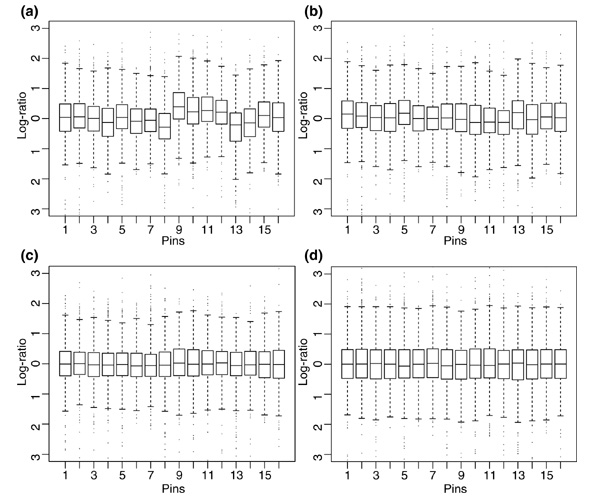
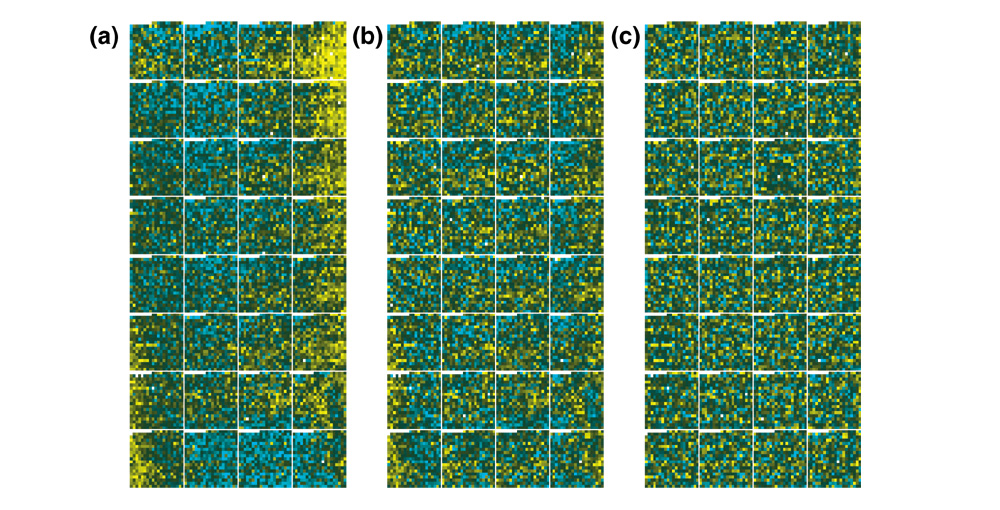
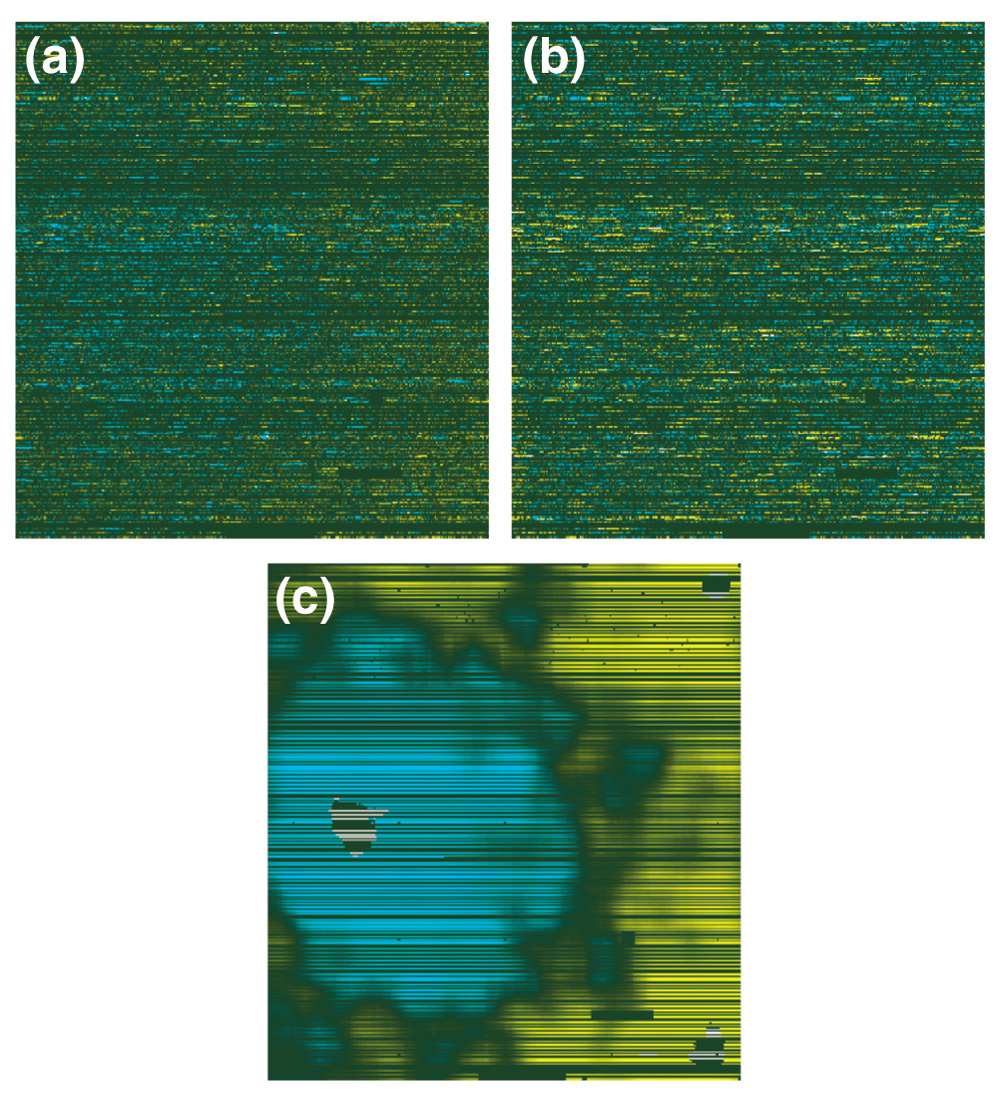
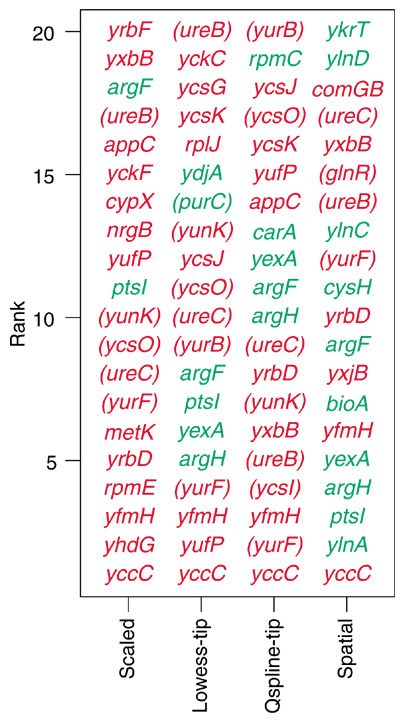
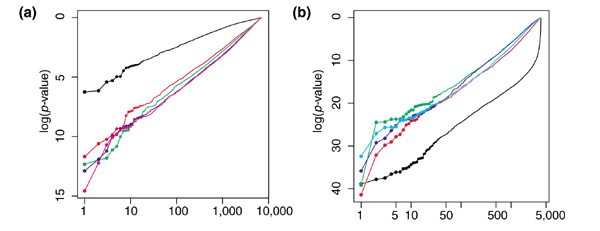
Results: We present here a simple and robust non-linear method for normalization using array signal distribution analysis and cubic splines. These methods compared favorably to normalization using robust local-linear regression (lowess). The application of these methods to oligonucleotide arrays reduced the relative error between replicates by 5-10% compared with a standard global normalization method. Application to cDNA arrays showed improvements over the standard method and over Cy(3)-Cy(5) normalization based on dye-swap replication. In addition, a set of known differentially regulated genes was ranked higher by the t-test. In either cDNA or Affymetrix technology, signal-dependent bias was more than ten times greater than the observed print-tip or spatial effects.

Conclusions: Intensity-dependent normalization is important for both high-density oligonucleotide array and cDNA array data. Both the regression and spline-based methods described here performed better than existing linear methods when assessed on the variability of replicate arrays. Dye-swap normalization was less effective at Cy(3)-Cy(5) normalization than either regression or spline-based methods alone.


Figures

Figure 1
Figure 1
Signal-distribution comparison and QQ correlation plot. (a) Example array distribution plots (left) from kernel smoothed density estimates versus the log intensity data. The target distribution from v (black) is shown alongside that of an example array. (b) The QQ plot shows the correlation of the quantiles from x to the quantiles of the target v and describes a normalizing curve.
Figure 2
Figure 2
Signal distributions before and after normalization. Density estimates for the six oligonucleotide arrays of the HIV study (top row) and six cDNA arrays of the glnA study (bottom row): before normalization (left column), after lowess normalization (middle column), and after qspline normalization (right column). Scaled print-tip versions of lowess and qspline are shown for the glnA experiment and global lowess and qspline are shown for the HIV experiment. Control samples are shown in green and treatment samples (HIV-infected cells and glnA mutants) in red, along with the geometric means distribution in black for the six HIV arrays and the six Cy3 signals from glnA arrays. Signal distributions were calculated by Gaussian kernel density estimation.
Figure 3
Figure 3
Relative signal distributions before and after normalization. Relative signals (log-ratios) log(x)-log (v), for oligonucleotide arrays (HIV, top row) and cDNA arrays (glnA, bottom row). One distribution is shown for each microarray before normalization (left) after lowess normalization (centre) and after qspline normalization (right). Control samples are shown in green, treatment samples in red and normal distributions fitted to the median and MAD of all log-ratios in black.
Figure 4
Figure 4
Relative signal versus signal intensity. Deviation plots, log(xi/v) versus log(v), much like the MA plots of Yang et al. [11] for the three replicate oligonucleotide arrays (from left to right) from HIV-infected samples. The top three plots show systematic deviations before normalization, and the bottom three show deviations after qspline normalization. Plots for prenormalized data show a comparison of curve fits for: log-intensity scaling (red); lowess (green); invariant set (magenta); and qspline normalizations (blue).
Figure 5
Figure 5
Relative signal versus signal intensity of cDNA array data. Signal distributions (left column) and MA plots (middle and right columns) for an example microarray after print-tip scaling (top row), scaled print-tip lowess (middle row) and scaled print-tip qspline (bottom row). Cy3 channels are shown in green, Cy5 channels in red and a running median curve is plotted in black.
Figure 6
Figure 6
Effects of normalization on R/G ratios of dye-swapped arrays. MA plots for replicate arrays A and B showing log(RA/GA) (left column) log(RB/GB) (centre column) and dye-swap normalized log((RAGB)/(GARB)) (right column). The top row shows standard dye-swap normalization of otherwise unnormalized data. The middle and bottom rows show scaled print-tip lowess and scaled print-tip qspline normalization of the individual arrays and the subsequent dye-swap averaging normalization.
Figure 7
Figure 7
Median log-ratios by signal-based quartiles. Plots showing the median log-ratios (y axis) by quartiles (x axis) for each channel or array of experiments (rows) and for the different normalization methods (columns). The top row shows medians for the six arrays of the HIV experiment (control in green, HIV-infected in red) for data before normalization, after log-intensity scaling, lowess, rank-invariant set and qspline, respectively. The middle row shows medians for the 12 channels of the six glnA arrays (Cy3 in green and Cy5 in red) for data before normalization, log-intensity scaled by print-tip, scaled print-tip lowess, scaled print-tip qspline, and spatially scaled and smoothed (from left to right), respectively. The bottom row shows the four channels of the A. thaliana dye-swap replicate arrays 'A' and 'B', with wild-type channels in lower case, mutant in upper case, and with the same normalizations from left to right as were used in glnA plots above.
Figure 8
Figure 8
Box plots for R/G log-ratios by print tip. A strong print-tip bias can be seen after (a) global lowess or qspline but (b) is partially removed after scaling the R and G signals within each print-tip group before qspline normalization. Normalizing for (c) the spatial signal bias and (d) scaled print-tip lowess show more comparable tip distributions.
Figure 9
Figure 9
Spatial effects of normalization on R/G ratios. One of the two cDNA arrays from the dye-swap study showing Cy5/Cy3 log-ratios with a yellow-cyan color scale and indications defining the print-tip sectors. Upregulated probes are shown in yellow, unchanged in black and downregulated in cyan. (a) log-ratios after global qspline normalization where spatial and/or print-tip effects can clearly be seen. (b) The array after scaled print-tip lowess normalization; a noticeable improvement over the global approach is shown, but spatial bias within print-tip sectors can still be seen. (c) After spatial normalization little if any spatial bias can be seen.
Figure 10
Figure 10
Spatial effects on oligonucleotide arrays. An example oligonucleotide array showing log-ratios of PM versus geometric mean PM in a yellow-cyan color scale. The omitted MM probes, shown in black, appear as horizontal stripes. (a) Relative PM values after global normalization; (b) results after spatial normalization. (c)The difference (of log(PM)) between the two, representing the spatial bias used for normalization.
Figure 11
Figure 11
Top 20 t-test rankings for the glnA experiment. The B. subtilis genes found to be most significantly differentially regulated by the different normalization methods are shown. Genes known to be differentially regulated are in parenthesis. Genes in red are upregulated in the mutant strain whereas genes in green are downregulated.
Figure 12
Figure 12
t-test rank versus log p-value. Log-log plots showing the distribution of p-values for (a) the HIV study and (b) the glnA study (right). p-values from unnormalized data (black) are compared to log-signal scaling (red), lowess (green), rank invariant (magenta), qspline (blue) and spatial normalization (cyan). Scaled print-tip lowess and qspline are shown for the cDNA data of the glnA experiment, whereas their global versions are shown for the oligonucleotide data.

Similar articles

Cited by

References

    1. Li C, Wong WH. Model-based analysis of oligonucleotide arrays: Expression index computation and outlier detection. Proc Natl Acad Sci USA. 2001;98:31–36. - PMC - PubMed
    1. Li C, Wong WH. Model-based analysis of oligonucleotide arrays: model validation, design issues and standard error application. Genome Biol. 2001;2:research0032.1–0032.11. - PMC - PubMed
    1. Schadt EE, Li C, Su C, Wong WH. Analyzing high-density oligonucleotide gene expression array data. J Cell Biochem. 2000;80:192–202. - PubMed
    1. Schadt EE, Li C, Ellis B, Wong WH. Feature extraction and normalization algorithms for high-density oligonucleotide gene expression array data. J Cell Biochem. 2001;Suppl 37:120–125. - PubMed
    1. Cavalieri D, Townsend JP, Hartl DL. Manifold anomalies in gene expression in a vineyard isolate of Saccharomyces cerevisiae revealed by DNA microarray analysis. Proc Natl Acad Sci USA. 2000;97:12369–12374. - PMC - PubMed

Publication types

MeSH terms