. 2002 Sep;130(1):199-209.
doi: 10.1104/pp.003228.

Indole acetic acid distribution coincides with vascular differentiation pattern during Arabidopsis leaf ontogeny

Affiliations

Indole acetic acid distribution coincides with vascular differentiation pattern during Arabidopsis leaf ontogeny

Orna Avsian-Kretchmer et al. Plant Physiol. 2002 Sep.

Abstract

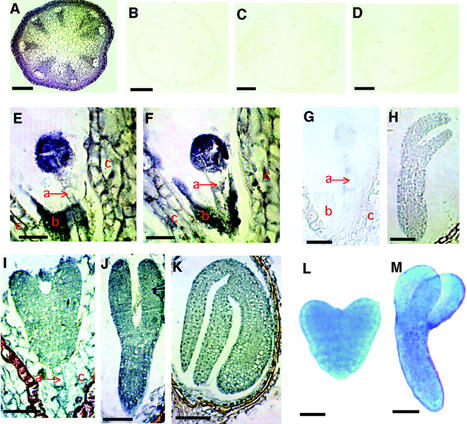
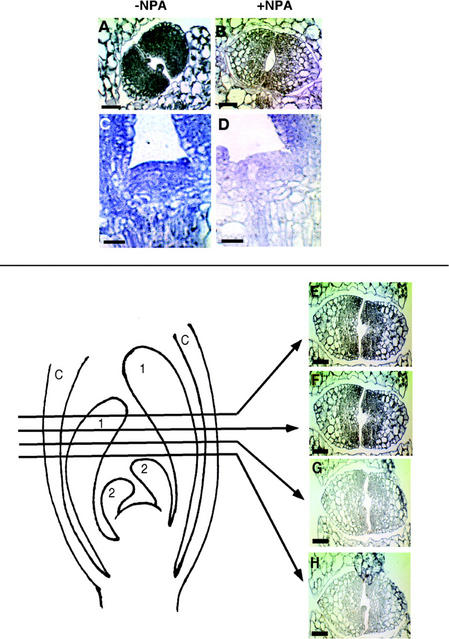
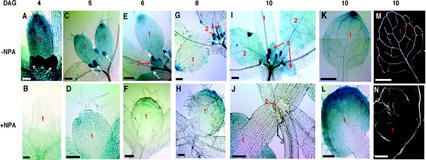
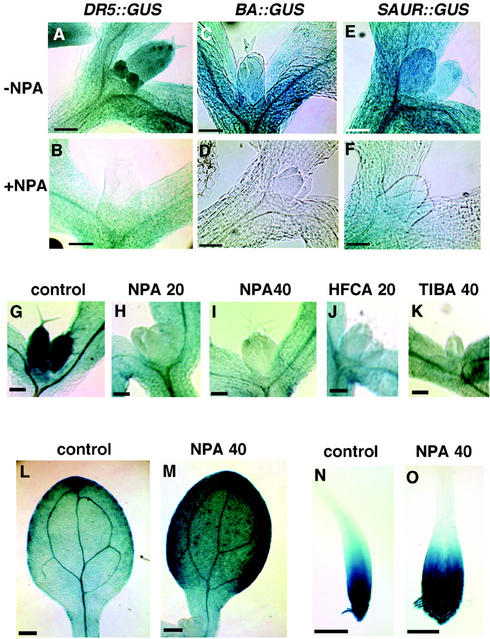
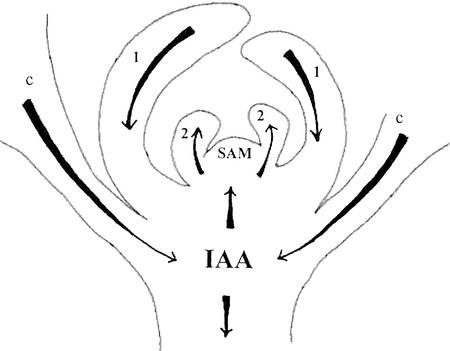
We used an anti-indole acetic acid (IAA or auxin) monoclonal antibody-based immunocytochemical procedure to monitor IAA level in Arabidopsis tissues. Using immunocytochemistry and the IAA-driven beta-glucuronidase (GUS) activity of Aux/IAA promoter::GUS constructs to detect IAA distribution, we investigated the role of polar auxin transport in vascular differentiation during leaf development in Arabidopsis. We found that shoot apical cells contain high levels of IAA and that IAA decreases as leaf primordia expand. However, seedlings grown in the presence of IAA transport inhibitors showed very low IAA signal in the shoot apical meristem (SAM) and the youngest pair of leaf primordia. Older leaf primordia accumulate IAA in the leaf tip in the presence or absence of IAA transport inhibition. We propose that the IAA in the SAM and the youngest pair of leaf primordia is transported from outside sources, perhaps the cotyledons, which accumulate more IAA in the presence than in the absence of transport inhibition. The temporal and spatial pattern of IAA localization in the shoot apex indicates a change in IAA source during leaf ontogeny that would influence flow direction and, consequently, the direction of vascular differentiation. The IAA production and transport pattern suggested by our results could explain the venation pattern, and the vascular hypertrophy caused by IAA transport inhibition. An outside IAA source for the SAM supports the notion that IAA transport and procambium differentiation dictate phyllotaxy and organogenesis.


Figures

Figure 1
Figure 1
IAA immunolocalization in Arabidopsis tissues. A through D, Cross sections of inflorescence stem. A, Stem tissues prefixed with ethyl-3(3-dimethylaminopropyl)carbodiimide hydrochloride (EDAC), embedded in paraffin, sectioned, and reacted with the anti-IAA antibody followed by anti-mouse IgG secondary antibody conjugated with alkaline phosphatase. There is a high level of IAA signal in the epidermal and cortical tissues and around vascular bundles: B through D, controls, showing very low levels of IAA signal; B, no EDAC prefixation; C, no primary antibody; D, no secondary antibody; E through K, longitudinal section of young siliques; E, eight-cell embryo; F, early globular stage embryo, showing high IAA signal in the embryo and endosperm cells (b) and a lower IAA level in the suspensor (a) and ovule cells (c); G, globular stage embryo with the omission of the primary anti-IAA antibody; and H, torpedo stage embryo with the omission of the secondary antibody. These controls show very low levels of the IAA signal: I, heart stage embryo; J, torpedo stage embryo; and K, walking stick stage embryo, showing high levels of IAA in the embryo. The suspensor (a), endosperm (b), and ovule cells (c) are indicated. L and M, GUS activity in embryos of DR5::GUS transgenic plants. L, Heart stage embryo; M, torpedo stage embryo showing high level of IAA in the embryos. Bar = 100 μm in A through D, 10 μm in E and F, 5 μm in G, 20 μm in H through J, 50 μm in K, 20 μm in L, and 50 μm in M.
Figure 2
Figure 2
IAA immunolocalization in leaf primordia and SAM. A and B, Cross sections of the shoot apex of 4-d-old seedlings were treated as described in the legend to Figure 1. A, Shoot apex of an untreated seedling, showing high IAA signal in the pair of first node leaf primordial. B, Shoot apex of a seedling grown in the presence of 40 μm NPA, showing little IAA signal in the leaf primordial. C and D, Longitudinal sections of 4-d-old seedlings. C, SAM of an untreated seedling, showing high IAA level. D, SAM of a seedling grown in the presence of 40 μm NPA, showing low IAA level. E through H, Serial cross sections of the shoot apex of 5-d-old seedlings that were treated as described in the legend to Figure 1. Drawing on the left depicts the sites where the four sections were made through the shoot apex including the first node (1) and second node (2) leaf primordia. Higher IAA levels are detected in the upper than in the lower sections. C, Petiole of the cotyledons. Bar = 20 μm in A and B, 10 μm in C and D, and 25 μm in E through H.
Figure 3
Figure 3
IAA distribution and venation pattern in transgenic plants grown in the presence and absence of 40 μm NPA. DR5::GUS activity in transgenic plants: A, 4-d-old shoot apex, showing the GUS-positive first true leaf and the stipules (white arrows); B, 4-d-old shoot apex in a seedling grown in the presence of NPA, showing very low levels of IAA; C, 5-d-old shoot apex showing the GUS-positive true leaves and their stipules (white arrows); D, 5-d-old shoot apex in a seedling grown in the presence of NPA, showing some GUS signal in the distal end of the leaf; E, 6-d-old shoot apex showing first node leaf primordium with declining GUS activity and second node leaves (red arrow) and stipules (white arrows) with high level of IAA; F, 6-d-old shoot apex in seedling grown in the presence of NPA, showing more GUS signal in the leaf tip and the emerging marginal veins; G, 8-d-old shoot apex showing the GUS activity in the second node leaves (red arrows) and stipules (white arrows), whereas the signal in the first node true leaves decreased and is concentrated in the leaf tip; H, 8-d-old shoot apex in a seedling grown in the presence of NPA, showing increased GUS signal and the expanding veins along the leaf margin; I, IAA distribution in the subsequent leaf nodes of a 10-d-old seedling, showing high IAA signal in the third node leaves (red arrows) and the stipules (white arrows) and lower signals in the second node leaves; J, second rosette leaves of 10-d-old seedlings grown in the presence of NPA, showing no IAA signal; K and L, GUS activity in the first true leaf of a 10-d-old seedling (K) and a 10-d-old seedling grown in the presence of 40 μm NPA (L); M and N, venation pattern and IAA distribution in the first true leaf of 10-d-old seedling. Seedlings were fixed in 6:1 (v/v) ethanol:acetic acid for 4 h at room temperature and then rinsed and whole mounted as described in “Materials and Methods”; M, venation pattern of the first true leaf, showing 1o, 2o, and 3o veins; N, venation pattern of a first true leaf of seedling grown in the presence of 40 μm NPA, showing the marginal and central hypertrophy; 1, first node leaves; 2, second node leaves; and 3, third node leaves. Bar = 20 μm in A and B, 50 μm in C and D, 100 μm in E and F, 200 μm in G through J, and 400 μm in K through N.
Figure 4
Figure 4
IAA distribution in seedlings containing a different IAA-inducible promoter::GUS and in a DR5::GUS-containing line treated with three different IAA transport inhibitors. A through F, GUS activity in 4-d-old transgenic seedlings containing different Aux/IAA promoter::GUS. A, DR5::GUS transgenic line; B, DR5::GUS transgenic line grown in the presence of 40 μm NPA; C, BA::GUS transgenic line; D, BA::GUS transgenic line grown in the presence of 40 μm NPA; E, SAUR-AC1::GUS transgenic line; and F, SAUR-AC1::GUS transgenic line grown in the presence of 40 μm NPA. G through K, GUS activity in a 5-d-old DR5::GUS transgenic line grown with a different IAA transport inhibitor; G, seedlings grown without any inhibitor, showing high level of GUS activity; H, seedlings grown in the presence of 20 μm NPA, showing low level of the GUS activity; I, seedlings grown in the presence of 40 μm NPA; J, seedlings grown in the presence of 20 μm 2-chloro-9-hydroxyfluorene-9-carboxylic acid (HFCA); K, seedlings grown in the presence of 40 μm 2,3,5-triiodobenzoic acid (TIBA); L, 5-d-old cotyledon, showing lower level of the GUS activity than a 5-d-old cotyledon of seedling grown in the presence of NPA (M); and N, 4-d-old root tip and O, 4-d-old root tip of seedling grown in the presence of 40 μm NPA, both showing high level of GUS activity. Bar = 50 μm in A through F, 100 μm in G through K, 200 μm in L and M, and 100 μm in N and O.
Figure 5
Figure 5
IAA flow model” in the shoot apex of Arabidopsis seedling. The youngest leaf primordia (marked “2” for second node leaves) and SAM do not produce IAA. Rather, IAA is being acropetally transported into this region. IAA is produced at the tip and marginal regions of the older leaf primordia (marked “1” for first node leaves) and basipetally drained, primarily through the midvein. Arrows represent flow direction of IAA. The IAA source for the youngest pair of leaf primordia and SAM may be the cotyledons (C), older leaves, and shoot tissues underneath the SAM. The acropetal flow of the IAA into the leaf primordia can explain the acropetal formation of the midvein. The time of IAA appearance in the distal end of the leaf corresponds to the time of secondary vein differentiation along the leaf margin, consistent with the notion that inability to drain IAA from the leaf tip basipetally through the midvein would cause marginal hypertrophy (Mattsson et al., 1999).

References

    1. Aloni R. The induction of vascular tissues by auxin and cytokinin. In: Davies PJ, editor. Plant Hormones: Physiology, Biochemistry and Molecular Biology. Ed 2. Dordrecht, The Netherlands: Kluwer Academic Publishers; 1995. pp. 531–546.
    1. Aloni R. Foliar and axial aspects of vascular differentiation: hypotheses and evidence. J Plant Growth Regul. 2001;20:22–34.
    1. Avery GS. Differential distribution of phytohormone in the developing leaf of Nicotiana, and its relation to polarized growth. Bull Toray Club. 1935;62:313–330.
    1. Ballas N, Wong LM, Ke M, Theologis A. Two auxin-responsive domains interact positively to induce expression of the early indolacetic acid-inducible gene PS-IAA4/5. Proc Natl Acad Sci. 1995;92:3483–3487. - PMC - PubMed
    1. Bartel B. Auxin biosynthesis. Annu Rev Plant Physiol Plant Mol Biol. 1997;48:51–66. - PubMed

Publication types

MeSH terms

LinkOut - more resources