

Gene expression profiling of peripheral blood mononuclear cells from cattle infected with Mycobacterium paratuberculosis
- PMID: 12228275
- PMCID: PMC128350
- DOI: 10.1128/IAI.70.10.5494-5502.2002
Gene expression profiling of peripheral blood mononuclear cells from cattle infected with Mycobacterium paratuberculosis
Abstract
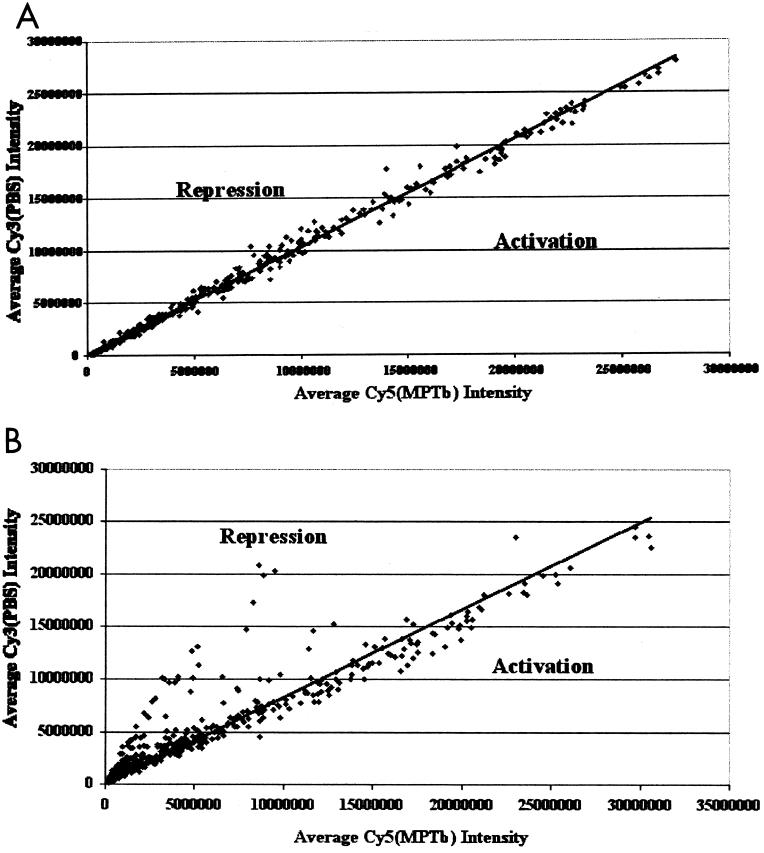
A bovine-specific cDNA microarray system containing 721 unique leukocyte expressed sequence tags (ESTs) and amplicons representing known genes was used to compare gene expression profiles of peripheral blood mononuclear cells (PBMCs) from clinical and subclinical Johne's disease-positive Holstein cows (n = 2 per group). Stimulation of PBMCs from clinically infected cows with Mycobacterium paratuberculosis tended to decrease expression of 83 genes (fold change, >1.5). Of these 83 genes, 16 displayed significant down regulation across both clinical cows (P < 0.1), including genes encoding microspherule protein 1, fibroblast growth factor, and the Lyn B protein kinase. Only eight genes from PBMCs of clinically infected cows exhibited a modest up regulation following stimulation with M. paratuberculosis, including those encoding bovine CD40L, gamma interferon, interleukin-10 (IL-10), and tissue inhibitor of matrix metalloproteinases (TIMP) 4. In contrast, stimulation of PBMCs from subclinically infected cows with M. paratuberculosis tended to up regulate expression of 71 genes representing 68 unique transcripts. Of these, 11 genes showed significant up regulation (fold change, >1.5; P < 0.1) across both animals, including those encoding bovine CD40L, several matrix metalloproteinases, and SPARC (secreted protein, acidic and rich in cystine). Repression of gene expression was also observed in PBMCs from the subclinical cows, with 16 genes being significantly down regulated (fold change, >1.5; P < 0.1) across both animals, including those encoding the bovine orthologs of cytochrome oxidase subunit III, IL-1 receptor type I, and fibrinogen-like 2 protein. Only one clone, representing an unknown bovine EST, was similarly down regulated in PBMCs from both the clinical and subclinical cows. Thus, the most prominent change induced by exposure of PBMCs from clinical cows to M. paratuberculosis in vitro tended to be repression of gene expression, while changes in similarly treated PBMCs from subclinical cows was balanced between gene activation and repression. Comparison of gene expression profiles between PBMCs from clinical and uninfected (control) cows stimulated with the general mitogen concanavalin A were highly similar (overall r = 0.84), suggesting that M. paratuberculosis-induced gene repression in clinically infected cow PBMCs was not due to a general failure of the immune response in these animals.
Figures
Similar articles
-
Cytokine gene expression in peripheral blood mononuclear cells and tissues of cattle infected with Mycobacterium avium subsp. paratuberculosis: evidence for an inherent proinflammatory gene expression pattern.Infect Immun. 2004 Mar;72(3):1409-22. doi: 10.1128/IAI.72.3.1409-1422.2004. Infect Immun. 2004. PMID: 14977946 Free PMC article.
-
Evidence for a novel gene expression program in peripheral blood mononuclear cells from Mycobacterium avium subsp. paratuberculosis-infected cattle.Infect Immun. 2003 Nov;71(11):6487-98. doi: 10.1128/IAI.71.11.6487-6498.2003. Infect Immun. 2003. PMID: 14573671 Free PMC article.
-
Rapid and transient activation of gene expression in peripheral blood mononuclear cells from Johne's disease positive cows exposed to Mycobacterium paratuberculosis in vitro.Microb Pathog. 2004 Feb;36(2):93-108. doi: 10.1016/j.micpath.2003.09.007. Microb Pathog. 2004. PMID: 14687562
-
Antigen-specific regulatory T cells in bovine paratuberculosis.Vet Immunol Immunopathol. 2008 Oct 15;125(3-4):234-45. doi: 10.1016/j.vetimm.2008.05.019. Epub 2008 Jul 3. Vet Immunol Immunopathol. 2008. PMID: 18602164 Review.
-
Genomic and transcriptomic studies in Mycobacterium avium subspecies paratuberculosis.Vet Immunol Immunopathol. 2010 Dec 15;138(4):303-11. doi: 10.1016/j.vetimm.2010.10.008. Epub 2010 Nov 2. Vet Immunol Immunopathol. 2010. PMID: 21047690 Review.
Cited by
-
Molecular analyses of disease pathogenesis: application of bovine microarrays.Vet Immunol Immunopathol. 2005 May 15;105(3-4):277-87. doi: 10.1016/j.vetimm.2005.02.015. Vet Immunol Immunopathol. 2005. PMID: 15808306 Free PMC article. Review.
-
Mammary expression of new genes to combat mastitis.J Anim Sci. 2003;81 Suppl 3(15 Suppl 3):38-47. doi: 10.2527/2003.81suppl_338x. J Anim Sci. 2003. PMID: 15000405 Free PMC article. Review.
-
Antigen stimulation of peripheral blood mononuclear cells from Mycobacterium bovis infected cattle yields evidence for a novel gene expression program.BMC Genomics. 2008 Sep 29;9:447. doi: 10.1186/1471-2164-9-447. BMC Genomics. 2008. PMID: 18823559 Free PMC article.
-
Pan-genomic analysis of bovine monocyte-derived macrophage gene expression in response to in vitro infection with Mycobacterium avium subspecies paratuberculosis.Vet Res. 2012 Mar 28;43(1):25. doi: 10.1186/1297-9716-43-25. Vet Res. 2012. PMID: 22455317 Free PMC article.
-
Innate gene repression associated with Mycobacterium bovis infection in cattle: toward a gene signature of disease.BMC Genomics. 2007 Oct 31;8:400. doi: 10.1186/1471-2164-8-400. BMC Genomics. 2007. PMID: 17974019 Free PMC article.
References
-
- Adams, J. L., and C. J. Czuprynski. 1994. Mycobacterial cell wall components induce the production of TNF-alpha, IL-1, and IL-6 by bovine monocytes and the murine macrophage cell line RAW 264.7. Microb. Pathog. 16:401-411. - PubMed
-
- Alzuherri, H. M., C. J. Woodall, and C. J. Clarke. 1996. Increased intestinal TNF-alpha, IL-1 beta and IL-6 expression in ovine paratuberculosis. Vet. Immunol. Immunopathol. 49:331-345. - PubMed
-
- Aster, J. C., and W. S. Pear. 2001. Notch signaling in leukemia. Curr. Opin. Hematol. 8:237-244. - PubMed
-
- Bakker, D., P. T. Willemsen, and F. G. van Zijderveld. 2000. Paratuberculosis recognized as a problem at last: a review. Vet. Q. 22:200-204. - PubMed
Publication types
MeSH terms
Substances
LinkOut - more resources
Full Text Sources
Other Literature Sources
Research Materials
Miscellaneous
