. 2002 Sep 15;16(18):2350-64.
doi: 10.1101/gad.223302.

The suppression of brain cold-stable microtubules in mice induces synaptic defects associated with neuroleptic-sensitive behavioral disorders

Affiliations

The suppression of brain cold-stable microtubules in mice induces synaptic defects associated with neuroleptic-sensitive behavioral disorders

Annie Andrieux et al. Genes Dev. .

Abstract

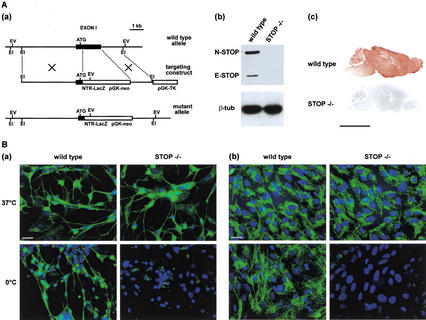
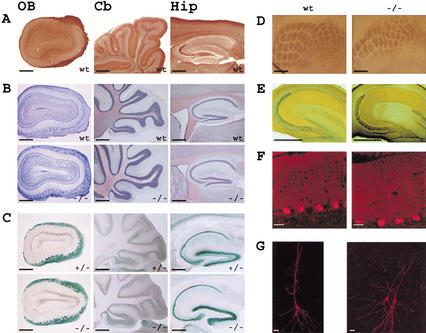
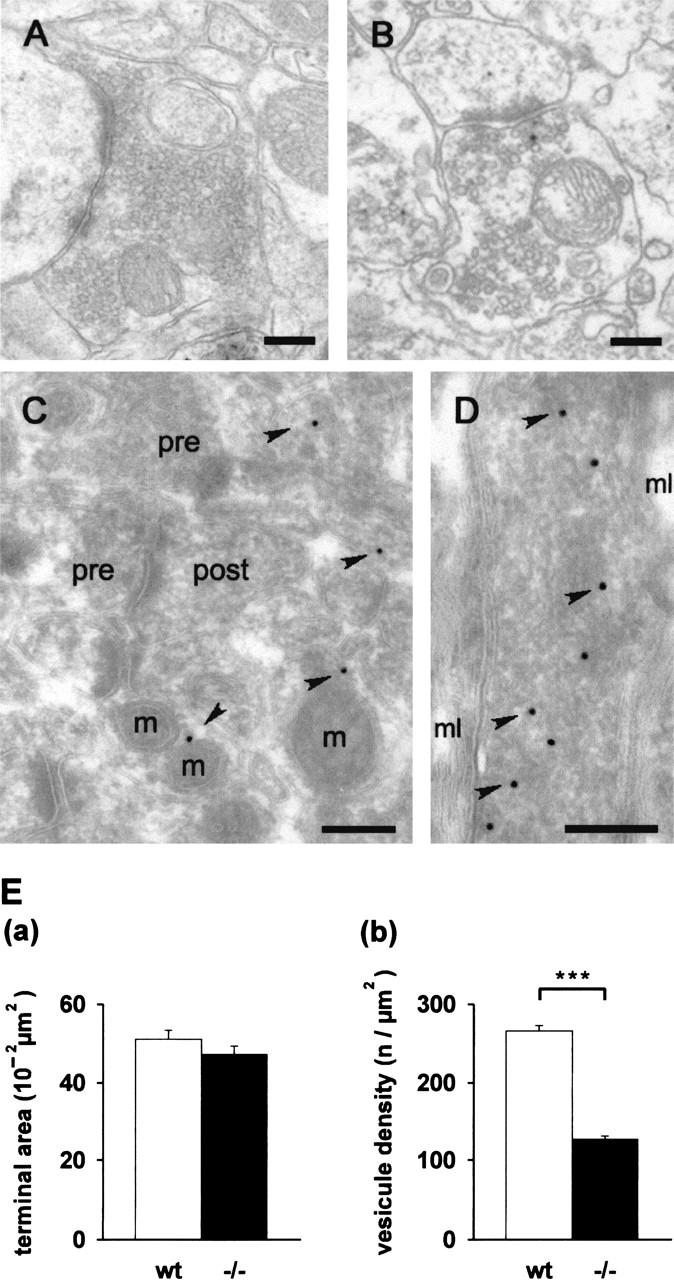
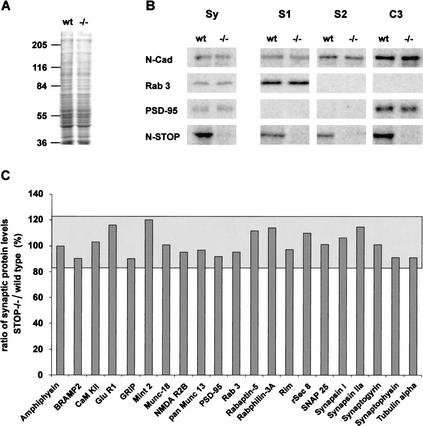
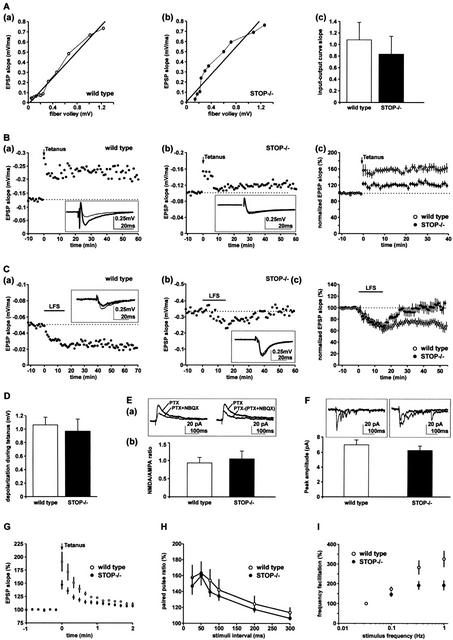
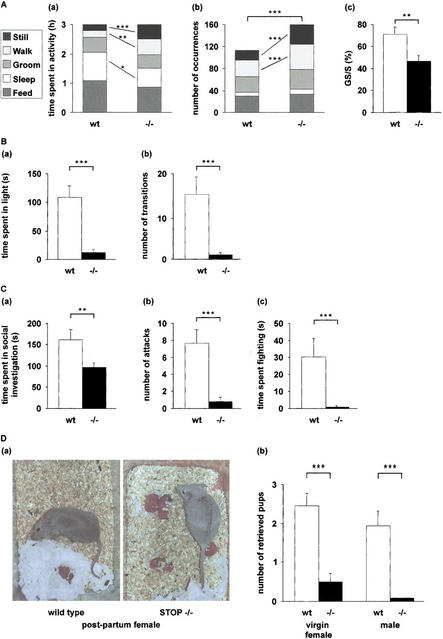
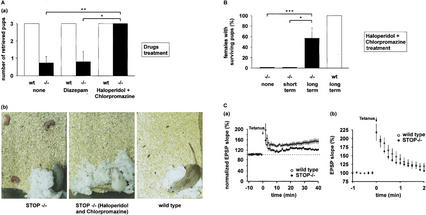
Neurons contain abundant subsets of highly stable microtubules that resist depolymerizing conditions such as exposure to the cold. Stable microtubules are thought to be essential for neuronal development, maintenance, and function. Previous work has indicated an important role of the microtubule-associated protein STOP in the induction of microtubule cold stability. Here, we developed STOP null mice. These mice were devoid of cold-stable microtubules. In contrast to our expectations, STOP-/- mice had no detectable defects in brain anatomy but showed synaptic defects, with depleted synaptic vesicle pools and impaired synaptic plasticity, associated with severe behavioral disorders. A survey of the effects of psychotropic drugs on STOP-/- mice behavior showed a remarkable and specific effect of long-term administration of neuroleptics in alleviating these disorders. This study demonstrates that STOP is a major factor responsible for the intriguing stability properties of neuronal microtubules and is important for synaptic plasticity. Additionally, STOP-/- mice may yield a pertinent model for study of neuroleptics in illnesses such as schizophrenia, currently thought to result from synaptic defects.


Figures

Figure 1
Figure 1
STOP suppression in mice. (A) Generation of STOP−/− mice. (a) Genomic organization of STOP gene, showing disruption of STOP exon 1. EI, Eco RI; EV, Eco RV; TK, thymidine kinase. (b) Western blot analysis of STOP expression in wild-type and STOP−/− mice. Brain extracts on immunoblots were assayed for STOP content using polyclonal STOP antibody 23C (Guillaud et al. 1998). Equivalent loading is demonstrated using antibodies specific for β-tubulin. (c) STOP immunostaining in parasagittal brain sections from adult wild-type or STOP−/− mice. Bar, 5 mm. (B) Microtubule stability. Analysis of microtubule cold stability in primary cultures of neuronal cells (a) and of glial cells (b) from wild-type or STOP−/− embryos. Cells from both wild-type mice and STOP−/− mice were either maintained at 37°C or exposed to the cold (0°C for 45 min). Following free tubulin extraction by cell permeabilization (Guillaud et al. 1998), microtubules were stained with anti-β-tubulin (green) and nuclei with Hoescht 33258 (blue). Bars, 20 μm.
Figure 2
Figure 2
Brain anatomy in STOP−/−, STOP+/−, and wild-type adult mice. (A) STOP distribution in the olfactory bulb (OB), cerebellum (Cb), and hippocampus (Hip) from wild-type mice (wt). Parasagittal brain sections were stained with 23C STOP antibody. (B) Cell layer organization in wild-type (wt) and STOP−/− (−/−) mice, in the brain regions shown in A. Parasagittal brain sections were stained with cresyl-violet. (C) LacZ expression in parasagittal brain sections from heterozygous mice (+/−) and STOP−/− (−/−) mice, revealed by β-galactosidase activity. (D) Barrel field organization of the somatosensory cortex in wild-type (wt) and STOP−/− (−/−) mice. Tangential brain sections were stained to reveal the cytochrome oxidase activity pattern. (E) Mossy fiber organization in wild-type (wt) and STOP−/− (−/−) mice. Staining for zinc by the Timm sulfide-silver method showed similar mossy fiber pathway in wild-type and STOP−/− mice. (F) Dendritic organization of Purkinje cells in wild-type (wt) and STOP−/− (−/−) mice. Cerebellum sections stained for calbindin indicated normal dendritic arborization in STOP−/− mice. (G) Representative examples of CA1 pyramidal cells in wild-type (wt) and STOP−/− (−/−) mice. The pictures were obtained by confocal imaging of neurons intracellularly labeled with neurobiotin. The pyramidal cells shown in STOP−/− were both injected. A total number of 27 STOP−/− CA1 pyramidal cells were examined and exhibit normal somatodendritic organization. Bars, AE, 0.5 mm; F, 20 μm; G, 40 μm.
Figure 3
Figure 3
Ultrastructural analysis of synapses and localization of STOP in the hippocampus. Electron micrographs of the stratum radiatum area in CA1. (A,B) Epon-embedded sections. The axons terminals of wild-type (A) and of STOP−/− mice (B) showed similar general ultrastructural organization with the synaptic specialization clearly visible under both conditions. However, the number of synaptic vesicles per synapse area was markedly decreased in the STOP−/− mice. (C,D) Ultrathin cryosections. Immunogold localization of STOP in wild-type mice showed a widespread distribution in the neuronal extensions near the nerve terminals. (C) A dispersed labeling was found in dendritic spines. (D) A more concentrated labeling of STOP was found in the axoplasm, as shown in a longitudinal cross-section of a myelinated axon. The diameter of the gold particles, indicated by arrowheads, is 15 nm. pre, presynaptic terminal; post, postsynaptic terminal; m, mitochondria; mL, myelin sheath. Bars, 200 nm. (E) Quantitative analysis of synaptic vesicle density: (a) Surface of the presynaptic nerve terminals. (b) Synaptic vesicle density, calculated as the ratio of the number of vesicles/nerve terminal surface (after subtraction of the surface area occupied by mitochondria). Results (mean ± s.e.m.) are shown for pooled 150 measurements from three wild-type mice and similar measurements from three STOP−/− mice. The vesicle density was twofold lower in STOP−/− mice compared to wild-type. ***, P < 0.01, t-test.
Figure 4
Figure 4
Biochemical composition of synaptosomal fractions in STOP−/− mice. (A) Coomassie blue-stained SDS-PAGE of synaptosomal fractions from wild-type and STOP−/− mice. No obvious difference in protein content was found between the two fractions. Total synaptosomal proteins (Sy) and fractions S1, S2, and C3 from wild-type and STOP−/− mice (see Materials and Methods) were analyzed by quantitative immunoblotting with 125I-labeled secondary antibody and phosphorimager detection. (B) Representative immunoblots of synaptosomal proteins. Equal amounts of protein from fractions Sy and equal volumes of each fraction, S1, S2, and C3 from wild-type and STOP−/− mice were analyzed on the same immunoblot. With this procedure, signal intensities in fractions S1, S2, and C3 reflect the distribution of proteins among these fractions. In both phenotypes, protein profiles were similar (except for N-STOP). N-Cadherin, a pre- and postsynaptic protein, was found in all fractions; Rab3, a presynaptic protein, was found only in S1 fraction, and PSD-95, a postsynaptic protein tightly associated with the postsynaptic density, was found in the insoluble fraction C3. N-STOP protein was found in all fractions with a higher concentration in fraction C3. (C) Synaptic proteins profiles. The ratios of synaptic protein levels in STOP−/− vs. wild-type were plotted (n = 2). Results are shown for fraction Sy. The limits of the gray area corresponds to the 95% confidence interval, determined by ANOVA. All observed ratios were within this confidence interval. Similar analysis with fractions S1, S2, and C3 showed no significant difference (data not shown).
Figure 5
Figure 5
Analysis of long- and short-term synaptic plasticity in STOP−/− mice. (A) Basic synaptic transmission. The input-output curves corresponding to Schaffer collateral synaptic responses were generated by computing fiber volley amplitude against field EPSP slope in a slice from one wild-type (a) or from one STOP−/− mouse (b). (c) Summary results of input-output curves obtained from six wild-type and six STOP−/− mice. The slopes of the curves were not significantly different, showing normal basic synaptic transmission in STOP−/− mice. (B) LTP experiments at the Schaffer collateral-CA1 pyramidal cell synapses. (a) A high-frequency stimulation (tetanus, four 100 Hz, duration 1 sec stimuli, given 10–20 sec apart) induced a long-term increase in the EPSP slope in a slice from wild-type mice. Sample traces (average of five successive sweeps) were taken 5 min before the tetanus (thin line) and at the end of the experiment (thick line). (b) A similar tetanus induced only a weak increase in the EPSP slope in a slice from STOP−/− mice. Sample traces were as in a. (c) Summary of LTP experiments (mean ± s.e.m.) in wild-type and STOP−/− mice. Initial EPSP slopes were normalized in each experiment using the averaged slope value during the control period (−10 to 0 min). Data were from 13 and nine slices obtained from seven wild-type and six STOP−/− mice, respectively. Results showed significant impairment of LTP in STOP−/− mice (P = 0.0007, unpaired t-test, computed at 30–40 min). (C) LTD experiments at the Schaffer collateral-CA1 pyramidal cell synapses. (a) A low-frequency stimulation (LFS, 1 Hz, 15 min) induced a long-term decrease in the EPSP slope in slices from wild-type mice. Samples traces (average of five successive sweeps) were taken 5 min before LFS (thin line) and at the end of the experiment (thick line). (b) LFS did not induce a long-term decrease in the EPSP slope in slices from STOP−/− mice. Samples traces were as in a. (c) Summary of LTD experiments (mean ± s.e.m.) in wild-type and STOP−/− mice. Data were from 15 and nine slices from nine wild-type and six STOP−/− mice, respectively. Results showed significant impairment of LTD in STOP−/− mice (P = 0.01, unpaired t-test, computed at 40–45 min). (D) Depolarization during tetanic stimulation of Schaffer collateral. Summary graph quantifying depolarization during tetanic stimulation. Depolarization was calculated at 300 msec from the beginning of the first 100 Hz stimulus. Experiments were run using 11 wild-type and eight STOP−/− slices obtained from seven wild-type and six STOP−/− mice, respectively. Results were not significantly different between wild-type and STOP−/− slices. (E) NMDA response at Schaffer collateral-CA1 pyramidal cell synapses. (a) Averaged traces of evoked EPSCs (average of 15 traces) obtained from a CA1 pyramidal cell recorded in a STOP−/− slice. (Left) Recordings first done in picrotoxin (PTX, Vhold = +30 mV), then in the presence of added 10 μM NBQX (PTX + NBQX) to isolate the NMDA receptor-mediated response. (Right) plot of the difference between PTX and PTX+NBQX traces (AMPA response). The PTX trace (NMDA + AMPA response) is also shown for comparison. (b) Summary graph of the NMDA/AMPA ratio obtained by computing NMDA EPSC amplitudes against AMPA EPSC amplitudes in seven and seven cells from four wild-type and four STOP−/− mice, respectively. No significant differences were observed between wild-type and STOP−/− cells. The NMDA/AMPA ratio was quantified for a stimulus intensity corresponding to two times the threshold for evoked EPSCs. (F) Quantal analysis of strontium-induced asynchronous EPSCs in CA1 pyramidal cells. Superimposed traces of asynchronous EPSCs obtained from neurons in wild-type and in STOP−/− mice (recordings done in 8 mM SrCl2 and in picrotoxin, Vhold = −70 mV). Summary graph of the asynchronous AMPA EPSCs obtained in nine and nine cells from five wild-type mice and five STOP−/− mice, respectively. No significant differences were observed between wild-type and STOP−/− cells. (G) Posttetanic potentiation (PTP) of Schaffer collateral synaptic transmission. A high-frequency stimulation in the presence of NMDA antagonist D-APV (50–100 μM) induced a transient increase in the EPSP slope. Data were from six and 10 slices obtained from four wild-type and five STOP−/− mice, respectively. Results showed impaired PTP in STOP−/− mice (P = 0.04, unpaired t-test from 0 to 30 sec after tetanus). (H) Paired pulse facilitation (PPF) of Schaffer collateral synaptic transmission. Data were from seven and 12 slices obtained from four wild-type and five STOP−/− mice, respectively. PPF was not significantly modified in STOP−/− mice. (I) Hippocampal mossy fiber frequency facilitation. Data were from 10 and 12 slices from six wild-type and seven STOP−/− mice, respectively. In wild-type mice, repetitive stimulation of mossy fiber synapses using stimulation frequencies from 0.033 to 1 Hz resulted in an over threefold increase in the amplitude of mossy fiber response. Facilitation was significantly impaired in STOP−/− mice (P = 0.03, unpaired t-test, data computed for 1-Hz stimulation frequency).
Figure 6
Figure 6
Behavioral defects in STOP−/− mice. (A) Mouse activities. Mouse activities (sleeping, feeding, grooming, walking, and remaining still while awake) were videotaped during a 3-h period. n = 11 for both wild-type and STOP−/− mice. (a) Time spent in each activity. Each block corresponds to an activity as indicated (left panel). STOP−/− mice spent more time walking and remaining still than wild-type mice, with a decrease in the time spent sleeping and feeding. (b) Number of occurrences of each activity. Compared to wild-type mice, STOP−/− mice showed a higher number of activity shifts, with increased occurrence of phases of walk and stillness. (c) Percent of grooming phases followed by a sleeping phase (GS) over total number of sleeping phases (S; mean ± s.e.m). Percents were calculated for each mouse and averaged. The GS sequence typical of wild-type mice was often broken in STOP−/− mice. (B) Anxiety-related behavior in STOP−/− mice. Anxiety-related behavior was assessed in eight wild-type mice and six STOP−/− mice using the light/dark test. (a) Time spent in the lit compartment over a 5-min period (mean ± s.e.m.). (b) Number of transitions between the two compartments (mean ± s.e.m.). Compared to wild-type mice, STOP−/− mice spent less time in the lit compartment and showed a smaller number of transitions between compartments. (C) Social behavior in STOP−/− mice. Social behavior was assessed using the resident-intruder test. (a) Social investigation. Time spent by the resident male actively pursuing social investigation of the intruder male (mean ± s.e.m.; n = 11 for wild-type mice and n = 13 for STOP−/− mice). (b,c) Intermale aggression. Aggression tests were conducted for two consecutive days and were recorded on day 2. (b) Number of aggressive encounters. (c) Time spent in fighting (mean ± s.e.m.; n = 11 for wild-type and n = 10 for STOP−/−). −/−, STOP−/− mice; wt, wild-type mice; *, P<0.05; **, P<0.02; ***, P<0.01, Mann-Whitney nonparametric U-test. (D) Nurturing defects in STOP−/− mice. (a) Photographs of wild-type and STOP−/− primiparous females showing typical postures shortly after giving birth. Wild-type mice: the pups are in the nest. STOP−/− mice: the pups are scattered within the bedding. (b) Pup retrieving test in wild-type and STOP−/− mice. Pup retrieving tests were run using virgin females or males as indicated. Trained mice were exposed to three pups placed in the three corners of the cage distant from the nest, and the number of pups retrieved by each mouse was scored. Scores were averaged for each genotype and are plotted on this figure (mean ± s.e.m.). n = 9 for both wild-type and STOP−/− females. n = 10 for wild-type males and n = 9 for STOP−/− males. −/−, STOP−/− mice; wt, wild-type mice.
Figure 7
Figure 7
Effects of neuroleptics on behavioral and synaptic defects in STOP−/− mice. (A) Effect of short-term drug treatment on pup retrieving in wild-type and STOP−/− postpartum females. Pup retrieving was tested within the first day postpartum, in mice treated with neuroleptics (haloperidol-chlorpromazine) or anxiolytic (diazepam), or in untreated mice. Drug administration began 6–8 d before delivery, and continued through delivery. Females were exposed to three pups from their own litter, and the number of pups retrieved by each female over a 30-min period was scored. (a) Retrieving scores. Scores were averaged for each genotype and treatment (mean ± s.e.m.; n = 6 for both wild-type and STOP−/− mice in each group). −/−, STOP−/− mice; wt, wild-type mice; *, P<0.05; **, P<0.02; ***, P<0.01, Mann-Whitney nonparametric U-test. (b) Photographs showing the end result of pup retrieving tests in wild-type and STOP−/− females. In the absence of treatment, STOP−/− females failed to retrieve pups, whereas neuroleptic-treated STOP−/− mice and wild-type females retrieved the three pups, which are underneath the mothers. (B) Effect of long-term neuroleptic treatment on pup survival in wild-type and STOP−/− mice. Pup survival was never observed in untreated STOP−/− mice (n = 20) or in short-term neuroleptic-treated STOP−/− mice (n = 8). In contrast, pup survival was observed in four of seven STOP−/− mice subjected to long-term (4 mo) neuroleptic treatment. −/−, STOP−/− mice; wt, wild-type mice; *, P<0.05; **, P<0.02; ***, P<0.01, Fisher exact test. (C) Effect of long-term neuroleptic treatment on synaptic plasticity in wild-type and STOP−/− mice. Mice were treated with neuroleptics for 4 mo starting at weaning. No neuroleptics were added during the slice recording. (a) LTP experiments at the Schaffer collateral-CA1 pyramidal cell synapses in wild-type and STOP−/− mice. Initial EPSP slopes were normalized in each experiment using the averaged slope value during the control period (−10–0 min). Data (mean ± s.e.m.) were from eight and seven slices obtained from five wild-type and five STOP−/− mice, respectively. LTP was still impaired in STOP−/− mice (P = 0.018, t-test computed at 30–40 min). (b) Posttetanic potentiation (PTP) of Schaffer collateral synaptic transmission. Data were from nine and 14 slices obtained from six wild-type and seven STOP−/− mice, respectively. Following long-term neuroleptic treatment, PTP was not significantly different in wild-type and in STOP−/− mice (P = 0.79, unpaired t-test from 0 to 30 sec after tetanus).

Similar articles

Cited by

References

    1. Baas PW, Heidemann SR. Microtubule reassembly from nucleating fragments during the regrowth of amputated neurites. J Cell Biol. 1986;103:917–927. - PMC - PubMed
    1. Baas PW, Pienkowski TP, Cimbalnik KA, Toyama K, Bakalis S, Ahmad FJ, Kosik KS. Tau confers drug stability but not cold stability to microtubules in living cells. J Cell Sci. 1994;107:135–143. - PubMed
    1. Bear MF, Malenka RC. Synaptic plasticity: LTP and LTD. Curr Opin Neurobiol. 1994;4:389–399. - PubMed
    1. Bekkers JM, Clements JD. Quantal amplitude and quantal variance of strontium-induced asynchronous EPSCs in rat dentate granule neurons. J Physiol. 1999;516:227–248. - PMC - PubMed
    1. Bosc C, Cronk JD, Pirollet F, Watterson DM, Haiech J, Job D, Margolis RL. Cloning, expression, and properties of the microtubule-stabilizing protein STOP. Proc Natl Acad Sci. 1996;93:2125–2130. - PMC - PubMed

Publication types

MeSH terms