. 2002 Sep 15;543(Pt 3):819-34.
doi: 10.1113/jphysiol.2002.024638.

Contribution of a calcium-activated non-specific conductance to NMDA receptor-mediated synaptic potentials in granule cells of the frog olfactory bulb

Affiliations

Contribution of a calcium-activated non-specific conductance to NMDA receptor-mediated synaptic potentials in granule cells of the frog olfactory bulb

Benjamin J Hall et al. J Physiol. .

Abstract

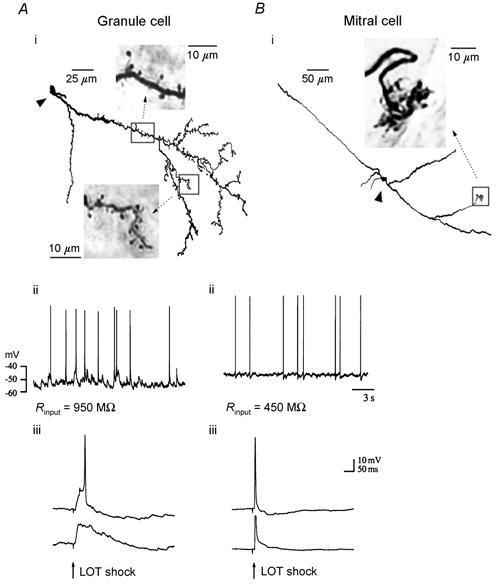
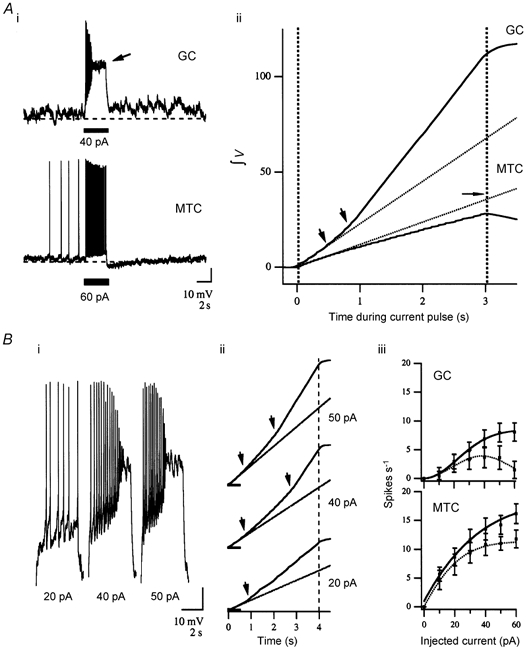
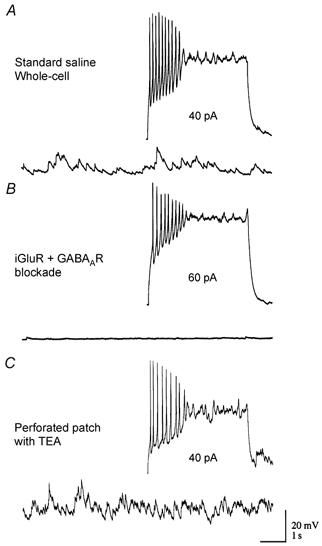
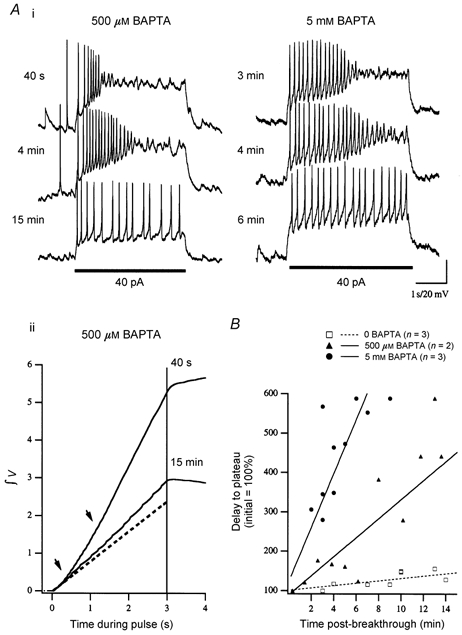
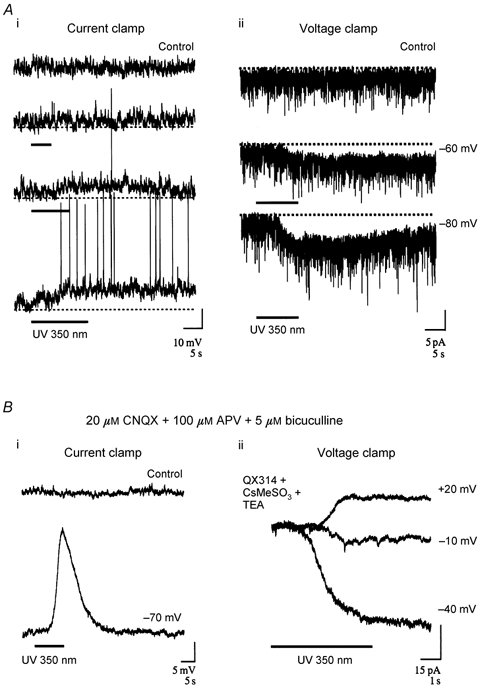
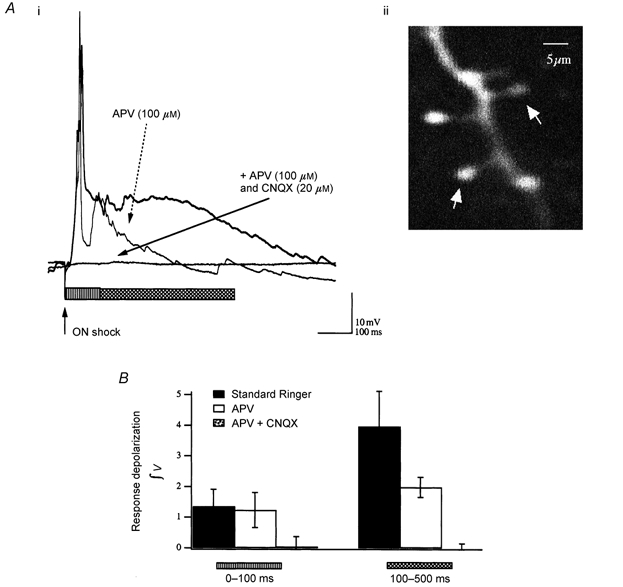
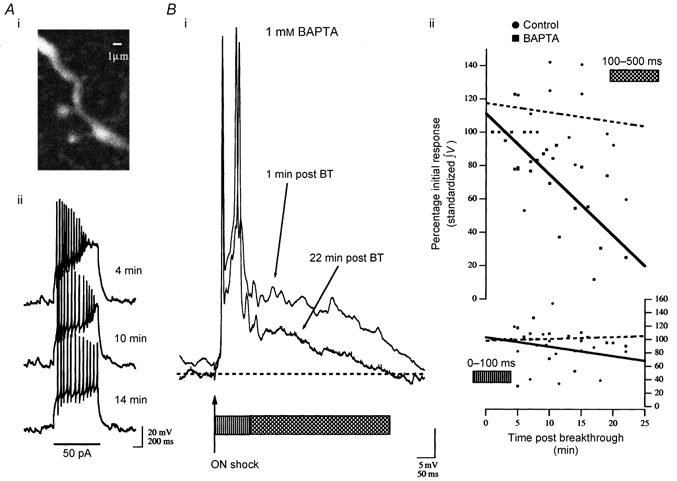
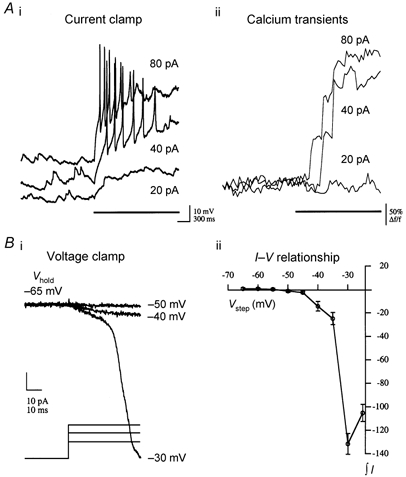
We studied granule cells (GCs) in the intact frog olfactory bulb (OB) by combining whole-cell recordings and functional two-photon Ca(2+) imaging in an in vitro nose-brain preparation. GCs are local interneurones that shape OB output via distributed dendrodendritic inhibition of OB projection neurones, the mitral-tufted cells (MTCs). In contrast to MTCs, GCs exhibited a Ca(2+)-activated non-specific cation conductance (I(CAN)) that could be evoked through strong synaptic stimulation or suprathreshold current injection. Photolysis of the caged Ca(2+) chelator o-nitrophenol-EGTA resulted in activation of an inward current with a reversal potential within the range -20 to +10 mV. I(CAN) in GCs was suppressed by the intracellular Ca(2+) chelator BAPTA (0.5-5.0 mM), but not by EGTA (up to 5 mM). The current persisted in whole-cell recordings for up to 1.5 h post-breakthrough, was observed during perforated-patch recordings and was independent of ionotropic glutamate and GABA(A) receptor activity. In current-clamp mode, GC responses to synaptic stimulation consisted of an initial AMPA-mediated conductance followed by a late-phase APV-sensitive plateau (100-500 ms). BAPTA-mediated suppression of I(CAN) resulted in a selective reduction of the late component of the evoked synaptic potential, consistent with a positive feedback relationship between NMDA receptor (NMDAR) current and I(CAN). I(CAN) requires Ca(2+) influx either through voltage-gated Ca(2+) channels or possibly NMDARs, both of which have a high threshold for activation in GCs, predicting a functional role for this current in the selective enhancement of strong synaptic inputs to GCs.


Figures

Figure 1
Figure 1. Anatomical and electrophysiological properties of recorded neurones
OB neurones were distinguished by their anatomical and electrophysiological properties in blind whole-cell recordings. Ai and Bi, reconstructions of neurobiotin-labelled cells from horizontal OB sections (300 μm). GC interneurones (Ai) were characterized by widely branching dendrites projecting rostrally in horizontal sections. GC dendrites were covered in gemmules and long-necked spines, up to 10 μm in length (insets - photomicrographs of the regions delineated by the boxes; arrowheads mark cell somata). MTC dendrites, by contrast, were aspiny. In the MTC shown (Bi) an apical dendrite can be followed rostrally, where it ramifies in an olfactory glomerulus (inset). Aii and Bii, traces of spontaneous synaptic activity from the cells in Ai and Bi show the characteristic differences between GC and MTC electrophysiology at rest. In the nose-brain preparation, large (> 5 mV) spontaneous depolarizing potentials in GCs occurred at rates of ≈5 Hz, while spontaneous synaptic activity was less prominent in MTCs. Rinput, input resistance. Aiii and Biii, lateral olfactory tract (LOT) stimulation evoked an antidromic AP in MTCs, which, in turn, synaptically activated the GC population. The antidromic AP in MTCs rose straight from baseline. Hyperpolarization (lower trace) did not block the AP but reversed the synaptically mediated after-hyperpolarization (the AP is truncated in the lower trace). In GCs, LOT stimulation produced an EPSP that increased at more hyperpolarized levels, while the AP was blocked.
Figure 2
Figure 2. Characterization of unique GC responses to direct current injection: ramping depolarization and non-stationary spike firing
Ai, voltage responses to suprathreshold current injection (at bar) in a GC and MTC from the same brain, demonstrating the qualitative differences in their response parameters. Sustained suprathreshold depolarization of GCs resulted in a slowly activating ‘ramping’ depolarization and superimposed APs, increasing in frequency. Prolonging this depolarization drove GCs to an inactivated plateau near -20 mV (arrow). All tested GCs responded in this manner, although not all exhibited an obvious after-depolarization (see text). MTC responses were consistent over the entire range of injected currents, responding with step depolarization and a superimposed train of APs. Spike accommodation in MTCs was evident. Aii, differences in depolarizing responses were quantified for the traces in Ai. Cumulative integrated voltage (in mV s) during the pulse is plotted against time (continuous lines) compared to a linear extrapolation of the expected integral based upon the first 500 ms of the response (dotted lines). Integrated MTC depolarizations were linear but fell slightly short of the extrapolation. This can be accounted for by the area lost due to declining spike frequency, an estimation of which is marked by the horizontal arrow. Integrations of GC responses were distinctly non-linear with two inflection points (arrowheads). The first corresponded to initiation of ramping depolarization early in the pulse, while the second corresponded to a rapid jump to inactivated plateau. Bi, responses are expanded for a range of current amplitudes in another GC. Evident is the underlying ramping depolarization, increased firing frequency and quick step to inactivated plateau. Bii, the direct relationship between current amplitude and ramp depolarization, as well as the inverse relationship between amplitude of injected current and time to inactivation are evident in the integration records (arrowheads). Biii, ramping depolarization in GCs resulted in distinct spike train parameters compared to MTCs. AP counts are shown for the 1st (continuous lines) and 3rd (dotted lines) seconds of the response in relation to injected current. MTCs showed a non-linear rise to maximum due to increased firing in conjunction with increasing accommodation. The GC plot is sigmoidal for the 1st second data due to the early increase in spike frequency. However, spike number in GCs declined in the 3rd second of the pulse and eventually even in the 1st second for large injected currents as the delay to onset of the inactivated plateau decreases.
Figure 3
Figure 3. Ramping depolarization in GCs is independent of ionotropic receptor activity and not related to cytoplasmic washout
A, a typical GC response to current injection is shown under standard recording conditions (top trace). The lower trace shows baseline spontaneous activity in the same cell at this time. B, GC responses in the same cell were tested following application of 20 μM CNQX + 50 μM APV and 5 μM bicuculline to block ionotropic receptor activity. Under these conditions, responses to direct current injection were unaffected (top trace) while spontaneous synaptic activity in the network was abolished (lower trace). iGluR, ionotropic glutamate receptor. C, GCs were recorded in the perforated-patch configuration using amphotericin B. In these recordings TEA (5 mm) was added to the intracellular solution to control for spontaneous breakthrough. Responses obtained through perforated patch at similar access resistances (within 20 min in all three cells tested) were indistinguishable from those obtained in standard whole-cell recordings.
Figure 4
Figure 4. Ramping depolarization to current injection is suppressed over time by addition of the intracellular Ca2+ chelator BAPTA
Ai, GCs loaded with intracellular BAPTA, pipette concentrations of either 500 μM (left) or 5 mm (right), were monitored for ramping depolarization during current injection (40 pA, at bar). Example traces are presented for one cell at each concentration at the indicated time post-breakthrough. Immediately following breakthrough (< 3 min), cells responded to current injection with ramping depolarization leading to inactivation typical of cells recorded in low (0.2–1 mm) EGTA and 0 BAPTA recording solutions. These phenomena were gradually suppressed and completely absent by 15 min post-breakthrough. Suppression was more rapid at the higher concentration of BAPTA (5 mm). Aii, suppression of the ramping depolarization is illustrated by plotting the cumulative integration of the voltage response ([mV s]/20). Examples are from the cell in Ai (500 μM BAPTA). At 40 s post-breakthrough the two obvious inflections (arrowheads) represent initial ramping depolarization and the subsequent step to inactivated plateau (cf. Fig. 2). At 15 min the cumulative voltage at the end of the pulse is substantially reduced, the slope of the line is decreased and the second inflection is absent due to removal of the inactivated plateau. The dashed line is an extrapolation calculated as an average from the first 500 ms of the 40 s response and 15 min after breakthrough. B, cumulative data are shown by plotting time to inactivation (inversely related to the strength of the ramping depolarization) with respect to time post-breakthrough for the cells tested at the concentrations shown in A (500 μM, n = 2 and 5 mmn = 3) as well as three control cells (0 BAPTA) for which a complete time series was acquired.
Figure 5
Figure 5. Activation of a Ca2+-dependent non-specific conductance in GCs by photolysis of a caged Ca2+ chelator
The caged Ca2+ chelator NP-EGTA was introduced by passive diffusion from whole-cell pipettes and photolysed with UV light (wavelength 350 nm) to demonstrate the sufficiency of cytoplasmic [Ca2+] to initiate a depolarizing current in GCs. Ai, recordings from a NP-EGTA-loaded GC in response to increasing duration of UV exposure (at bar). UV photolysis, ≈10 min after wash-in, resulted in a slowly activating depolarization that increased in duration with the length of the uncaging flash and persisted after the end of the pulse. Aii, voltage-clamp recordings from the cell in Ai in response to a UV flash at two different holding potentials and in the absence of UV flash (control trace at -60 mV). Photolysis (at bar) activated an inward current, the amplitude of which increased at more hyperpolarized potentials in response to the same uncaging stimulus. Bi, recordings from another current-clamped GC in the presence of extracellular ionotropic receptor blockade (CNQX + APV + bicuculline). A slowly activating depolarization outlasting the UV flash (at bar) was obvious in these recording conditions, confirming that calcium-evoked activation of this current was via an intrinsic mode of activation. Bii, voltage-clamp recordings from another GC are presented in the presence of ionotropic blockade and intracellular Na+ and K+ channel block (2 mm QX314 + 50 mm CsMeSO3 + 5 mm TEA). Under these conditions UV photolysis (at bar) evoked an inward current at potentials more hyperpolarized than -10 mV and reversed between this potential and +20 mV.
Figure 6
Figure 6. Synaptic responses to olfactory nerve shock in GCs: a late-phase NMDA-mediated component
Ai, characteristic recordings from a current-clamped GC demonstrate the presence of a late-phase, APV-sensitive, ‘plateau-like’ potential in response to olfactory nerve (ON) shock. Traces are responses to ON shock in normal saline (thick trace), after 10 min under NMDAR block (dashed arrow), and after addition of an AMPA receptor (AMPAR) antagonist (continuous arrow). The horizontal bars indicate 0–100 ms (striped bar) and 100–500 ms (hatched bar) of the response. Responses to nerve shock were thus primarily AMPAR mediated in the first 100 ms and predominantly carried by NMDA receptor channels between 100 and 500 ms. Aii, two-photon-excited fluorescence image (200 μM Oregon-Green-1 BAPTA 488) of the cell in Ai showing a small region of dendrite with the distinguishing spiny processes (arrows) that are characteristic of GCs. B, cumulative data from five neurones showing the average responses (means ± s.e.m.) before addition of extracellular blockers (Standard Ringer), after 10 min in the presence of APV and then > 5 min after additional application of CNQX (note n = 2 for combined APV + CNQX), which completely blocked both synaptic and spontaneous activity.
Figure 7
Figure 7. BAPTA suppression of ICAN depresses the NMDA-mediated synaptic component in GCs activated by olfactory nerve shock
Ai, a two-photon Oregon Green BAPTA 488 fluorescence image of a branch of the neurone in Aii and Bi showing the characteristic anatomy of a GC as confirmation of cellular type. Aii, characteristic responses to current injection in this GC are shown with 1 mm BAPTA + 200 μM Oregon Green BAPTA-1 in the recording pipette at the post-breakthrough times indicated. Bi, over the time course of BAPTA wash-in, a concurrent suppression of the late-phase (100–500 ms; hatched bar) NMDAR-mediated component of the synaptic response was observed. BT, breakthrough. Bii, cumulative, standardized data from four neurones showing the integrated voltage of the synaptic response for the response components indicated by the corresponding bars under the traces in Bi (100–500 ms (left axis) and 0–100 ms (right axis)) with respect to time post-breakthrough. Lines are linear regressions through the data to aid visualization of the trend without necessarily implying a linear model for the relationship (continuous line, 1 mm BAPTA; dashed line, control). The negative slope of the line fit to the BAPTA 100–500 ms interval (left axis) reflects suppression of this component compared to the control trace which shows little to no change 20 min after breakthrough. Comparing the data for the first 100 ms of the synaptic response (right axis) shows that suppression was specific to the late component.
Figure 8
Figure 8. Activation of VGCCs and Ca2+ influx in GCs
Whole-cell current-clamp recordings showed that substantial Ca2+ influx occurs only above AP threshold in GCs. Ai, electrophysiological traces showing typical GC responses to different levels of injected current (at bar). Note that the traces are slightly offset in the vertical dimension for clarity. Step-like responses to subthreshold current injection (20 pA) are contrasted by the slowly activating ramping depolarization seen in response to suprathreshold current pulses. Aii, Ca2+ transients (Oregon Green BAPTA 488 fluorescence measured from a dendrite with 2 ms line scans) resulting from the current injections shown in Ai demonstrate the correlation between Ca2+ influx and AP initiation. Ca2+ influx was not observed in response to subthreshold depolarization from a resting membrane potential of -60 mV, while the delay to the initial rise of [Ca2+] decreased with increasing current injection amplitude as the time to onset of AP initiation decreased. Characteristic GC responses to voltage steps, from an initial holding potential (Vhold) of -65 mV, are shown in Bi. Data were acquired in the presence of intracellular Na+ and K+ channel blockers (2 mm QX314 + 50 mm CsMeSO3 + 5 mm TEA). No inward current was activated at potentials below -45 mV. Under this protocol, whole-cell current amplitude peaked at between -30 and -20 mV. Bii, average data are plotted for four GCs under the same conditions and experimental paradigm as in Bi. Total integrated current (in pA s) during the step is plotted with respect to step voltage (Vstep; means ± s.e.m.). On average, GC recordings showed no current activation to voltage steps below ≈-45 mV, and the integrated whole-cell current response peaked at -30 mV.

Similar articles

Cited by

References

    1. Arakawa O, Nakahiro M, Narahashi T. Mercury modulation of GABA-activated chloride channels and non-specific cation channels in rat dorsal root ganglion neurons. Brain Research. 1991;551:58–63. - PubMed
    1. Berkowicz DA, Trombley PQ. Dopaminergic modulation at the olfactory nerve synapse. Brain Research. 2000;855:90–99. - PubMed
    1. Chen WR, Xiong W, Shepherd GM. Analysis of relations between NMDA receptors and GABA release at olfactory bulb reciprocal synapses. Neuron. 2000;25:625–633. - PubMed
    1. Delaney KR, Hall BJ. An in vitro preparation of frog nose and brain for the study of odour-evoked oscillatory activity. Journal of Neuroscience Methods. 1996;68:193–202. - PubMed
    1. Desmaisons D, Vincent JD, Lledo PM. Control of action potential timing by intrinsic subthreshold oscillations in olfactory bulb output neurons. Journal of Neuroscience. 1999;19:10727–10737. - PMC - PubMed

Publication types

MeSH terms

Substances

LinkOut - more resources