. 2002 Sep 15;543(Pt 3):859-70.
doi: 10.1113/jphysiol.2002.021519.

The relationship between intracellular [Ca(2+)] and Ca(2+) wave characteristics in permeabilised cardiomyocytes from the rabbit

Affiliations

The relationship between intracellular [Ca(2+)] and Ca(2+) wave characteristics in permeabilised cardiomyocytes from the rabbit

C M Loughrey et al. J Physiol. .

Abstract

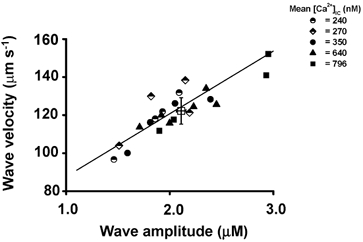
Spontaneous sarcoplasmic reticulum (SR) Ca(2+) release and propagated intracellular Ca(2+) waves are a consequence of cellular Ca(2+) overload in cardiomyocytes. We examined the relationship between average intracellular [Ca(2+)] and Ca(2+) wave characteristics. The amplitude, time course and propagation velocity of Ca(2+) waves were measured using line-scan confocal imaging of beta-escin-permeabilised cardiomyocytes perfused with 10 microM Fluo-3 or Fluo-5F. Spontaneous Ca(2+) waves were evident at cellular [Ca(2+)] > 200 nM. Peak [Ca(2+)] during a wave was 2.0-2.2 microM; the minimum [Ca(2+)] between waves was 120-160 nM; wave frequency was approximately 0.1 Hz. Raising mean cellular [Ca(2+)] caused increases in all three parameters, particularly Ca(2+) wave frequency. Increases in the rate of SR Ca(2+) release and Ca(2+) uptake were observed at higher cellular [Ca(2+)], indicating calcium-sensitive regulation of these processes. At extracellular [Ca(2+)] > 2 microM, the mean [Ca(2+)] inside the permeabilised cell did not increase above 2 microM. This extracellular-intracellular Ca(2+) gradient could be maintained for periods of up to 5 min before the cardiomyocyte developed a sustained and irreversible hypercontraction. Inclusion of mitochondrial inhibitors (2 microM carbonyl cyanide m-chlorophenylhydrazone and 2 microM oligomycin) while perfusing with > 2 microM Ca(2+) abolished the extracellular-intracellular Ca(2+) gradient through the generation of Ca(2+) waves with a higher peak [Ca(2+)] compared to control conditions. Under these conditions, cardiomyocytes rapidly (< 2 min) developed a sustained and irreversible contraction. These results suggest that mitochondrial Ca(2+) uptake acts to delay an increase in [Ca(2+)] by blunting the peak of the Ca(2+) wave.


Figures

Figure 2
Figure 2. Analysis of confocal line-scan images of Ca2+ waves
A, line-scan image of Ca2+ waves measured on perfusion of a permeabilised cardiomyocyte with an extracellular [Ca2+] of ≈260 nm Ca2+. The sections marked with the dashed lines are 20 pixel wide regions within the cell (IC) and in the extracellular solution (EC). B, a longer record of line-scan images from the permeabilised cardiomyocyte while raising the [Ca2+] in the perfusate from 40 nm to 260 nm (50 μM EGTA, 10 μM Fluo-3). The section marked by an asterisk is the region corresponding to the expanded trace in A. Subsequently, the cardiomyocyte was perfused with 375 nm and < 1 nm Ca2+ (* indicates total [EGTA] = 10 mm, 10 μM Fluo-3), as indicated above the trace. C (i), superimposed IC (grey trace) and EC fluorescence signals (black trace) from the line-scan shown in B. C (ii), average fluorescence signal of the last five Ca2+ waves (IC, grey trace) and the corresponding EC signal (black trace); the period averaged is indicated by the open box. D (i), IC and EC [Ca2+] signals calculated from the fluorescence signals obtained in 375 nm and < 1 nm Ca2+. D (ii), the averaged IC (grey) and EC (black) [Ca2+] calculated from the averaged fluorescence signals during the period indicated by the open box. E (i), higher-resolution IC and EC [Ca2+] signals. E (ii), averaged IC (grey) and EC (black) [Ca2+] signals displayed at a higher resolution during the period indicated by the open box. F (i), averaged Ca2+ signals over 10 s periods from IC (grey) and EC (black) signals. F (ii) mean IC and EC [Ca2+] signals during the period indicated by the open box.
Figure 1
Figure 1. Line-scan epifluorescence imaging of cardiomyocytes
A (i), line-scan epifluorescence image of a single permeabilised cardiomyocyte after incubation with thapsigargin (10 μM for 10 min). The brighter central region is due to the presence of Fluo-3 in the cell; dimmer flanking signals are from the Fluo-3 in the perfusing solutions. The calculated [Ca2+] in the perfusion solution is shown above the trace; control solutions contained a total concentration of EGTA ([EGTA]) and Fluo-3 of 50 μM and 10 μM, respectively. [Ca2+] marked by * indicates solutions containing a total [EGTA] of 10 mm. A (ii), mean fluorescence signal of a 20 pixel region from the intracellular (IC) and extracellular compartments (EC); these regions are indicated by dashed lines in A (i). The ratio of IC fluorescence/EC fluorescence (FIC/FEC) is plotted above (see right-hand axis). A (iii), IC and EC signals converted to [Ca2+] on the basis of the signals in 1.12 μM and <1 nm Ca2+. B (i), mean fluorescence signals from within a cardiomyocyte (IC, grey trace) and a similar region outside the cell (EC, black trace) on raising the external [Ca2+] from 40 nm to 170 nm (in 50 μM EGTA, 10 μM Fluo-3). At the points indicated above the trace, the solution was switched to one containing 375 nm Ca2+, then < 1 nm Ca2+ (10 mm EGTA). B (ii), IC and EC signals converted to [Ca2+] on the basis of the signals in 375 nm and < 1 nm Ca2+.
Figure 3
Figure 3. Records of Ca2+ waves at different values of extracellular [Ca2+]
Records of EC (black trace) and IC [Ca2+] (grey trace) derived from 20 pixel regions of line-scan images of cardiomyocytes perfused with solutions containing 50 μM EGTA, 10 μM Fluo-5F and the following [Ca2+]: A, 1.3 μM; B, 2.26 μM; C, 3.4 μM. The grey dashed line indicates the calculated mean intracellular [Ca2+].
Figure 4
Figure 4. Effect of prolonged exposure to high extracellular [Ca2+] on Ca2+ waves in cardiomyocytes
A, series of eight sequential line-scan images recorded from a single cardiomyocyte perfused with 2.6 μM Ca2+ (50 μM EGTA and 10 μM Fluo-5F). The gaps between images represent ≈5 s breaks between acquisition periods. Images during perfusion with 375 nm Ca2+ (10 mm EGTA*) and 1 nm Ca2+ (10 mm EGTA*) are indicated above the images. B, EC (black) and IC (grey) [Ca2+] signals derived from line-scan records of a hypercontracted cardiomyocyte during exposure to 2.6 μM Ca2+ (50 μM EGTA, 10 μM Fluo-5F). The grey dashed line indicates the calculated mean intracellular [Ca2+].
Figure 5
Figure 5. Effect of mitochondrial inhibitors on Ca2+ waves at high extracellular [Ca2+]
A (i) and (ii), sequential line-scan images recorded from permeabilised cardiomyocytes perfused with 2.3 μM Ca2+ (50 μM EGTA, 10 μM Fluo-5F) followed by perfusion with 375 nm* Ca2+ and 1 nm* Ca2+ (*10 mm [EGTA], 10 μM Fluo-5F). The gaps between images represent ≈5 s breaks between acquisition periods. B, records of EC (black trace) and IC (grey trace) [Ca2+] signals derived from 20 pixel regions of line-scan images of a cardiomyocyte perfused with 2.3 μM Ca2+ (50 μM EGTA, 10 μM Fluo-5F) under control conditions (i) and including mitochondrial inhibitors (+ MI) carbonyl cyanide m-chlorophenylhydrazone (CCCP, 2 μM) and oligomycin (2 μM) (ii). The grey dashed lines represent the mean intracellular [Ca2+] over the period shown.
Figure 6
Figure 6. Effect of mitochondrial inhibitors on [Ca2+] and Ca2+ wave parameters
Averages (± s.e.m.) of Ca2+ signals recorded from line-scan images of cardiomyocytes after perfusion with ≈0.4 μM (A) and ≈2.1 μM Ca2+ (B) in the absence (Control) and presence (+MI) of 2 μM CCCP, 2 μM oligomycin (n = 4 in each group). For each parameter (i.e. mean extracellular [Ca2+] (here denoted [Ca2+]ec), mean intracellular [Ca2+] (here denoted [Ca2+]ic), minimum [Ca2+], maximum [Ca2+] and wave frequency) significant differences between control and the + MI conditions are indicated (B). Significant differences existed between all of the individual Ca2+ wave characteristics measured at ≈0.4 μM and ≈2.3 μM [Ca2+](P < 0.001).
Figure 7
Figure 7. Relationship between various mean intracellular [Ca2+] and Ca2+ wave parameters, and mean extracellular [Ca2+]
A (i), a log-log plot of extracellular [Ca2+] vs mean intracellular [Ca2+] from 15 cardiomyocytes (Fluo-3, ▪, Fluo-5F, □), maximum [Ca2+] (wave peak), (Fluo-3, ▴; Fluo-5F, ▵), minimum [Ca2+] (Fluo-3, •, Fluo-5F, ○). The line indicates the unity relationship. A (ii), linear plot of extracellular [Ca2+] (300–900 nm range) vs maximum [Ca2+]. The continuous line is the best-fit linear correlation with gradient 0.77 ± 0.18 (P < 0.01). A (iii), linear plot of extracellular [Ca2+] (300–900 nm range) vs minimum [Ca2+] during a Ca2+ wave. The continuous line is the best-fit linear correlation, and has a gradient of 0.35 ± 0.03 (P < 0.001). B (i), a log-log plot of extracellular [Ca2+] vs. frequency of Ca2+ waves (▪) and wave velocity (○). B (ii), linear plot of extracellular [Ca2+] (300–900 nm range) vs Ca2+ wave frequency. The continuous line is the best-fit linear correlation, with gradient 5.5 × 10⁵ ± 1 × 10⁵ (waves s−1m−1; P < 0.01). B (iii), linear plot of extracellular [Ca2+] (300–900 nm range) vs wave velocity (no correlation). C (i), semilog plot of extracellular [Ca2+] vs rate of rise of Ca2+ wave measured at 1 μM Ca2+. The line shows the best-fit linear correlation. C (ii), semilog plot of the rate of decline of the Ca2+ wave measured at various values of extracellular [Ca2+]. The line shows the best-fit linear correlation.
Figure 8
Figure 8. Relationship between wave velocity and wave amplitude at different values of intracellular [Ca2+]
Plot of Ca2+ wave amplitude (i.e. peak [Ca2+] - minimum [Ca2+]) vs. wave velocity for a range of mean intracellular [Ca2+] values (here denoted [Ca2+]ic). Amplitude measurements were made from four to six Ca2+ waves from five cardiomyocytes. Each myocyte was exposed to an extracellular [Ca2+] ranging from 240 nm to 796 nm. The average (± s.e.m., n = 8) Ca2+ wave amplitude and velocity for cardiomyocytes exposed to < 1 μM extracellular [Ca2+] is plotted on the same graph (□). The line through the data is the best-fit linear correlation to the data, with a gradient of 33 ± 5 μm s−1 μM−1 (P < 0.03).

References

    1. Cheng H, Lederer MR, Lederer WJ, Cannell MB. Calcium sparks and [Ca2+]i waves in cardiac myocytes. American Journal of Physiology. 1996;270:C148–159. - PubMed
    1. Cromton M. Mitochondrial intermembrane junctional complexes and their role in cell death. Journal of Physiology. 2000;529:11–21. - PMC - PubMed
    1. Di Lisa F, Gambassi G, Spurgeon H, Hansford RG. Intramitochondrial free calcium in cardiac myocytes in relation to dehyrogenase activation. Cardiovascular Research. 1993;27:1840–1844. - PubMed
    1. Diaz ME, Trafford AW, O'Neill SC, Eisner DA. Measurement of sarcoplasmic reticulum Ca2+ content and sarcolemmal Ca2+ fluxes in isolated rat ventricular myocytes during spontaneous Ca2+ release. Journal of Physiology. 1997a;501:3–16. - PMC - PubMed
    1. Diaz ME, Trafford AW, O'Neill SC, Eisner DA. A measurable reduction of s. r. Ca content follows spontaneous Ca release in rat ventricular myocytes. Pflügers Archiv. 1997b;434:852–854. - PubMed

Publication types

LinkOut - more resources